NOK 62-day bearish forecast — Nov 15, 2026
- Bias: Bearish
- Timeframe: 62 days (made Nov 15, 2026, target date Jan 15, 2027)
- Price at analysis: $8.07
- Price target: $7.55
- Expected range: $6.70 – $8.75
- Result: Pending — graded after the close on Jan 15, 2027
Get a free AI analysis of NOK today
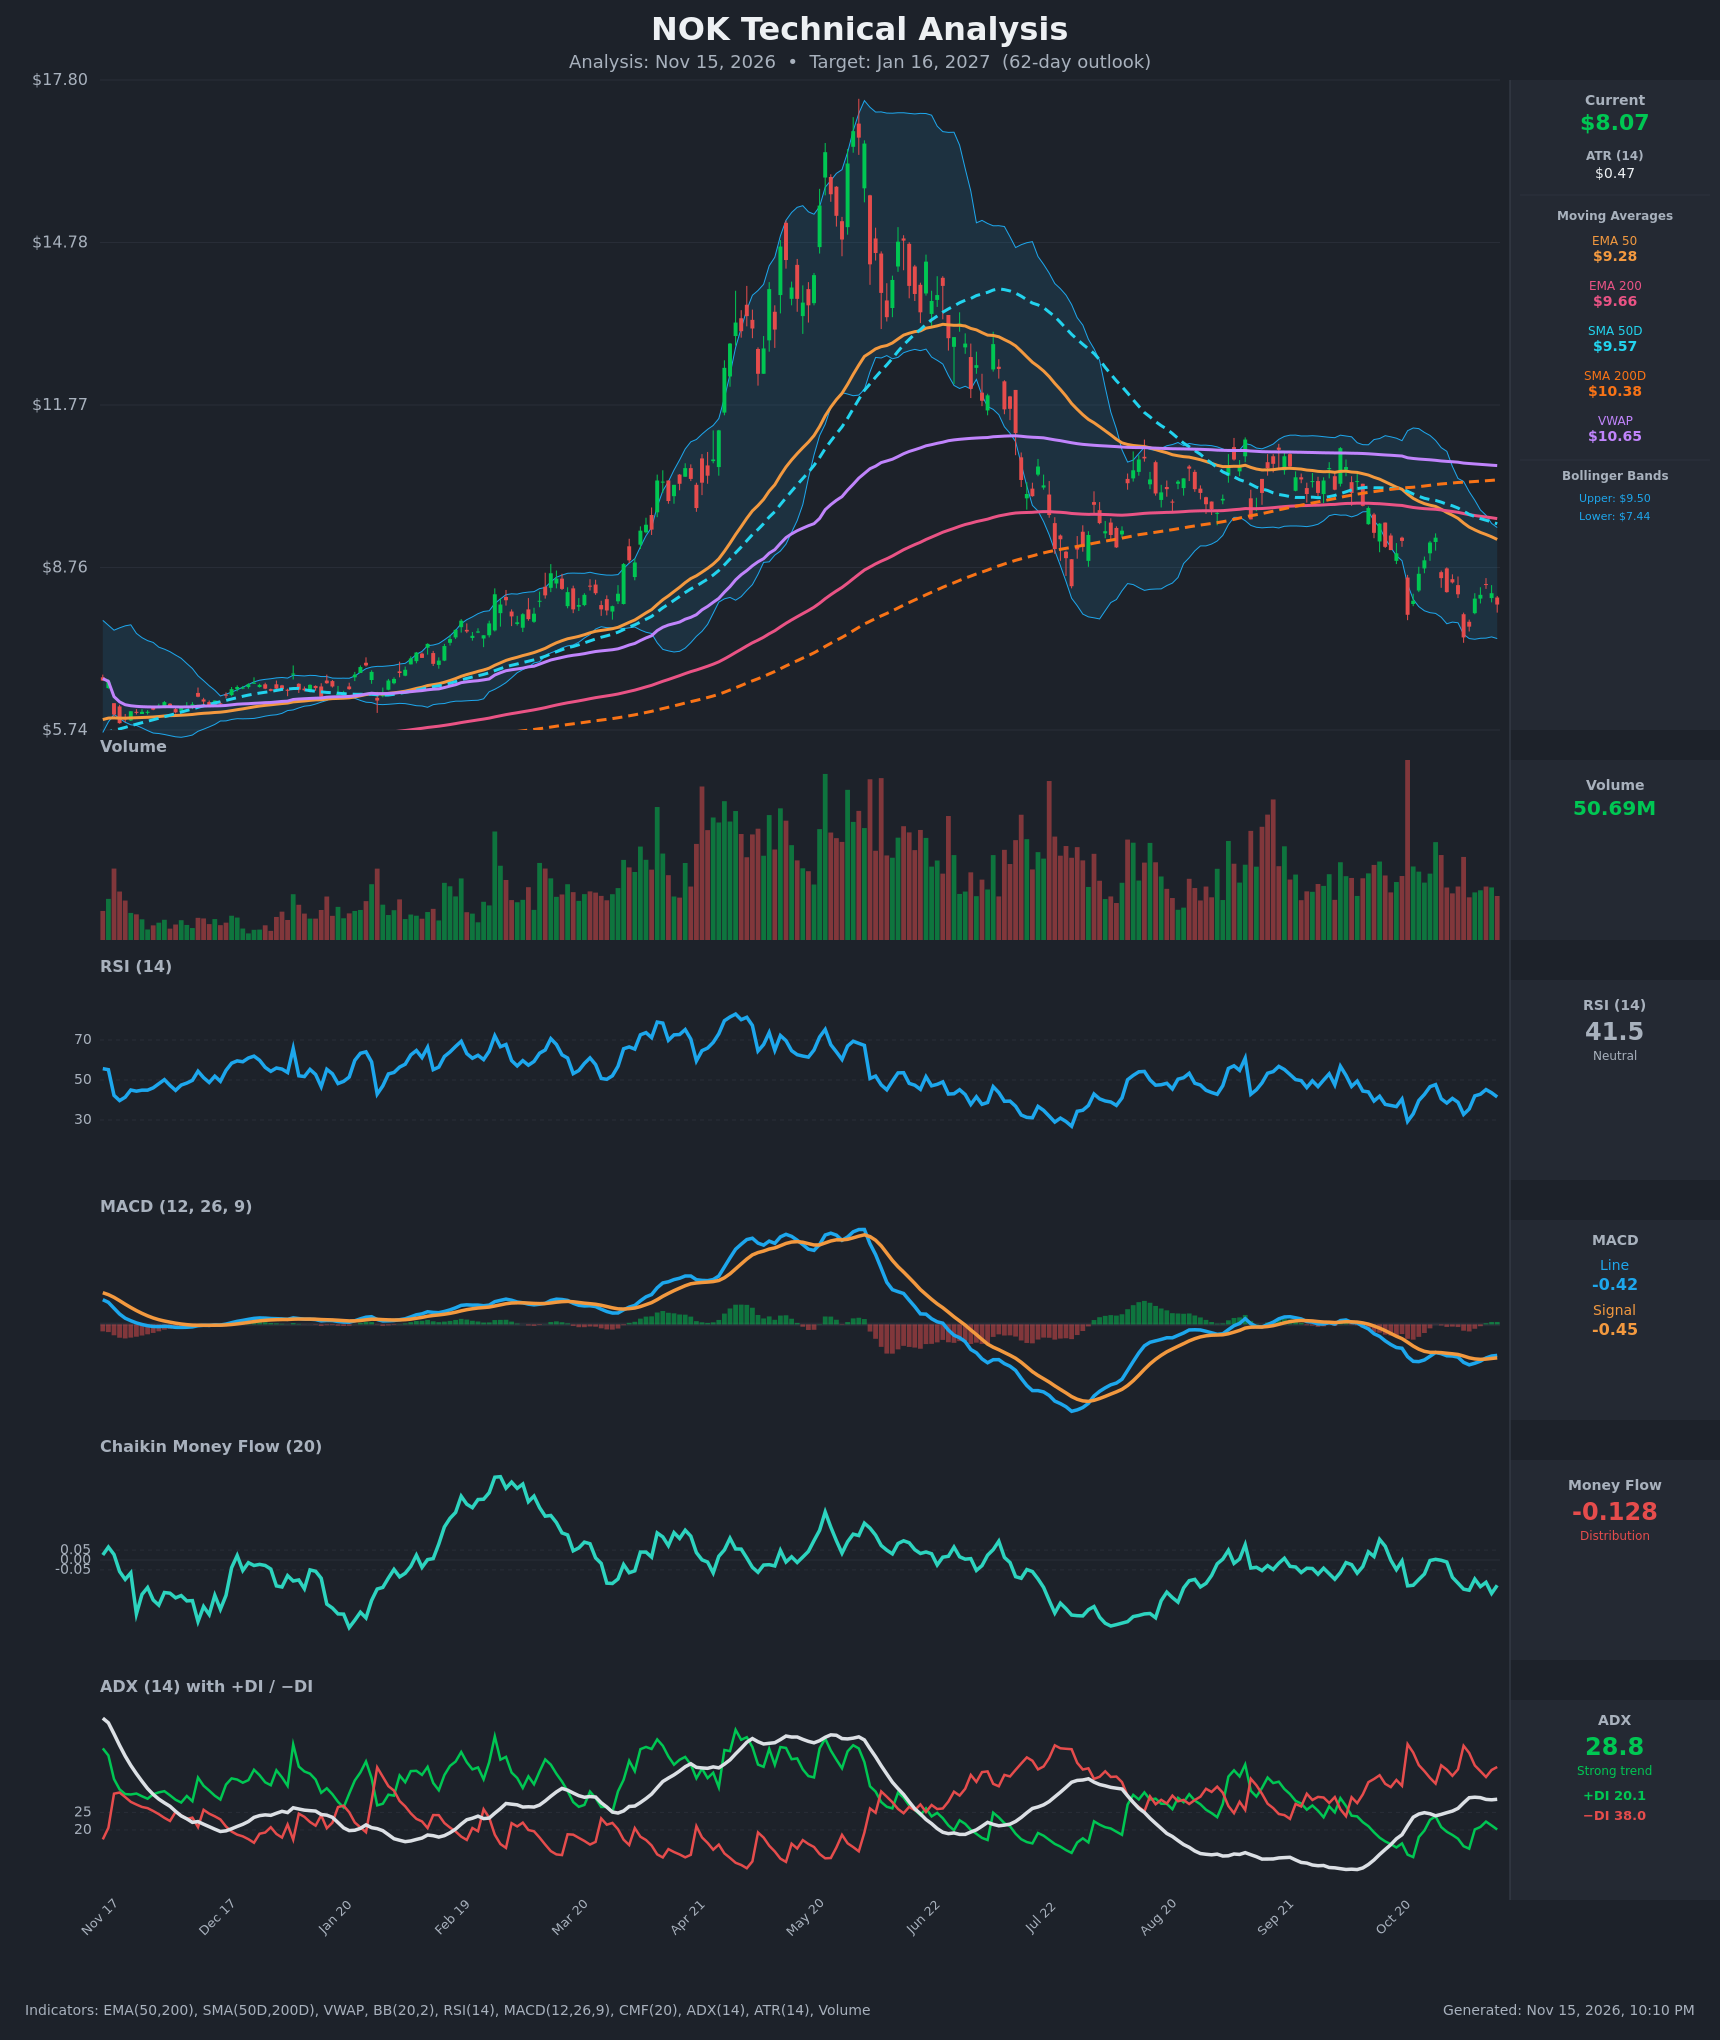
Analysis
TECHNICAL INDICATORS
- RSI (14): 41.52, below the 50 midline but not oversold. It bottomed at 32.8 on Nov 5 and bounced to 45.2 on Nov 11, but has since turned down again. Momentum is weak and has not yet reached the washed-out levels where reversals usually start. [Bearish]
- 20 EMA: The 20 EMA isn't supplied, so I used the EMA 50 as the nearest guide. Price at $8.07 sits well below the EMA 50 ($9.28) and EMA 200 ($9.66). Both are falling and act as overhead resistance. The EMA 50 crossed below the EMA 200 around Nov 2, a bearish crossover. [Bearish]
- MACD: The line (-0.419) is marginally above the signal (-0.452), so the histogram is barely positive. This is a minor bullish crossover (Nov 11-13) that happened deep below zero. Both lines are negative and the signal is still falling, so it reads as a small relief bounce inside a downtrend, not a reversal. [Neutral]
- Bollinger Bands (20): Upper $9.50, lower $7.44, with price at $8.07 in the lower third of the bands. The bands are wide, and the Nov 5 close of $7.46 touched the lower band before a modest bounce. There is no squeeze. Price is below the midline (~$8.47), which favors sellers. [Bearish]
- CMF (20): -0.128, well below -0.05 and negative for most of the last 15 bars (the only positive reading was +0.003 on Oct 29). Money is flowing out and rallies are being sold. [Distribution]
- ADX (14): 28.8 and rising from about 24.5. −DI (38.0) is far above +DI (20.1), so bears are firmly in control. +DI has been unable to hold above −DI during recent bounces. [Strong Trend – Bearish]
- Volume: 50.69M, roughly average to slightly elevated versus the recent average, and it spiked on the Nov 5 breakdown candle. Heavy volume on the down legs and lighter volume on the bounces suggests the selling is more committed than the buying. [Bearish bias]
DIVERGENCES & TRENDS
- Price vs MACD: The MACD line made a new low (-0.546) on Nov 6 as price hit $7.46, and has since recovered to -0.419 while price held near $8.0-8.4. This is a mild momentum improvement but not a true divergence. Price has not made a lower low with a higher MACD low.
- RSI: It made a higher low (32.8) after the Oct 30 low of 38.5, but the rebound only reached 45.2 and has rolled over. There is no confirmed bullish divergence.
- Moving-average structure: Price is below the SMA 50D ($9.57), SMA 200D ($10.38), EMA 50, EMA 200 and VWAP ($10.65). The SMA 50D crossed under the SMA 200D earlier (a death cross), and the EMA 50 crossed under the EMA 200 around Nov 2. The longer-term structure is a clear downtrend.
- DI/ADX trend: −DI has stayed on top throughout, and ADX is rebuilding above 25, which confirms trend strength after a weak spell in Aug-Sep.
- CMF: It is trending persistently negative and has made no higher low.
CHART PATTERNS
- Bearish Flag / Pennant (continuation): After the sharp drop from the ~$10 range to $7.46, price has formed a small, choppy consolidation between roughly $7.46 and $8.65. It is a bearish flag-like structure with lower highs ($9.31, then $8.44).
- Pattern target: The prior leg ran from about $10 to $7.46, roughly $2.5. Projecting a fraction of that from a flag breakdown below $7.46 points to the $6.60-$7.00 area.
- Longer-term view: The whole structure since the $17+ peak is a large head-and-shoulders-style distribution/downtrend. The bounce to the ~$10 area was a failed retest of the broken EMA 200, SMA 200D and VWAP.
- Caveat: If $7.46 holds and price reclaims $8.65, the pattern could evolve into a double bottom with a target near $9.3, so $7.46 is the key level.
POTENTIAL SCENARIOS
- Scenario 1: Bearish Flag Breakdown — Price fails to reclaim the $8.45-$8.65 area, then breaks the Nov 5 low and lower band. Sellers continue to dominate (−DI > +DI, CMF negative). Trigger: daily close below $7.44-$7.46 on rising volume. Target: $6.70-$7.20. Invalidation: daily close above $8.65 with CMF turning positive. (50% probability)
- Scenario 2: Bullish Relief Rally / Double Bottom — The MACD bullish crossover and the held $7.46 low fuel a bounce back toward the declining EMA 50 and the Bollinger midline/upper band. Trigger: close above $8.65, then above $9.30. Target: $9.30-$9.60 (EMA 50 / SMA 50D / upper band). Invalidation: loss of $7.46. (30% probability)
- Scenario 3: Neutral Range Consolidation — Price chops between $7.45 and $8.65 as ADX stalls and momentum resets. Trigger: repeated failures at both $8.65 and $7.46. Target: $7.60-$8.30. Invalidation: a close outside the $7.40-$8.70 band. (20% probability)
PRICE TARGETS
- Target Price: $7.55 (62-day, about -6.4% from current)
- Expected Range: $6.70 to $8.75 (width $2.05, about 25% of current price, in line with the 61-180 day guidance)
- Key Levels: Support at $7.46 (Nov 5 low, lower Bollinger Band area ~$7.44), Resistance at $8.65 (recent bounce highs / Bollinger midline zone, then EMA 50 at $9.28)
OVERALL BIAS
OVERALL BIAS: BEARISH - Price is below every major moving average, −DI (38.0) dominates +DI (20.1) with ADX at 28.8 and rising, and CMF at -0.128 shows persistent distribution, with a bearish flag setting up under the $7.46 support. The minor MACD crossover and a not-yet-oversold RSI temper conviction, so a failed breakdown and relief bounce remains a real risk.
This is educational analysis and not financial advice.