NOK 48-day bearish forecast — Nov 15, 2026
- Bias: Bearish
- Timeframe: 48 days (made Nov 15, 2026, target date Jan 1, 2027)
- Price at analysis: $8.07
- Price target: $7.55
- Expected range: $6.60 – $8.80
- Result: Pending — graded after the close on Jan 1, 2027
Get a free AI analysis of NOK today
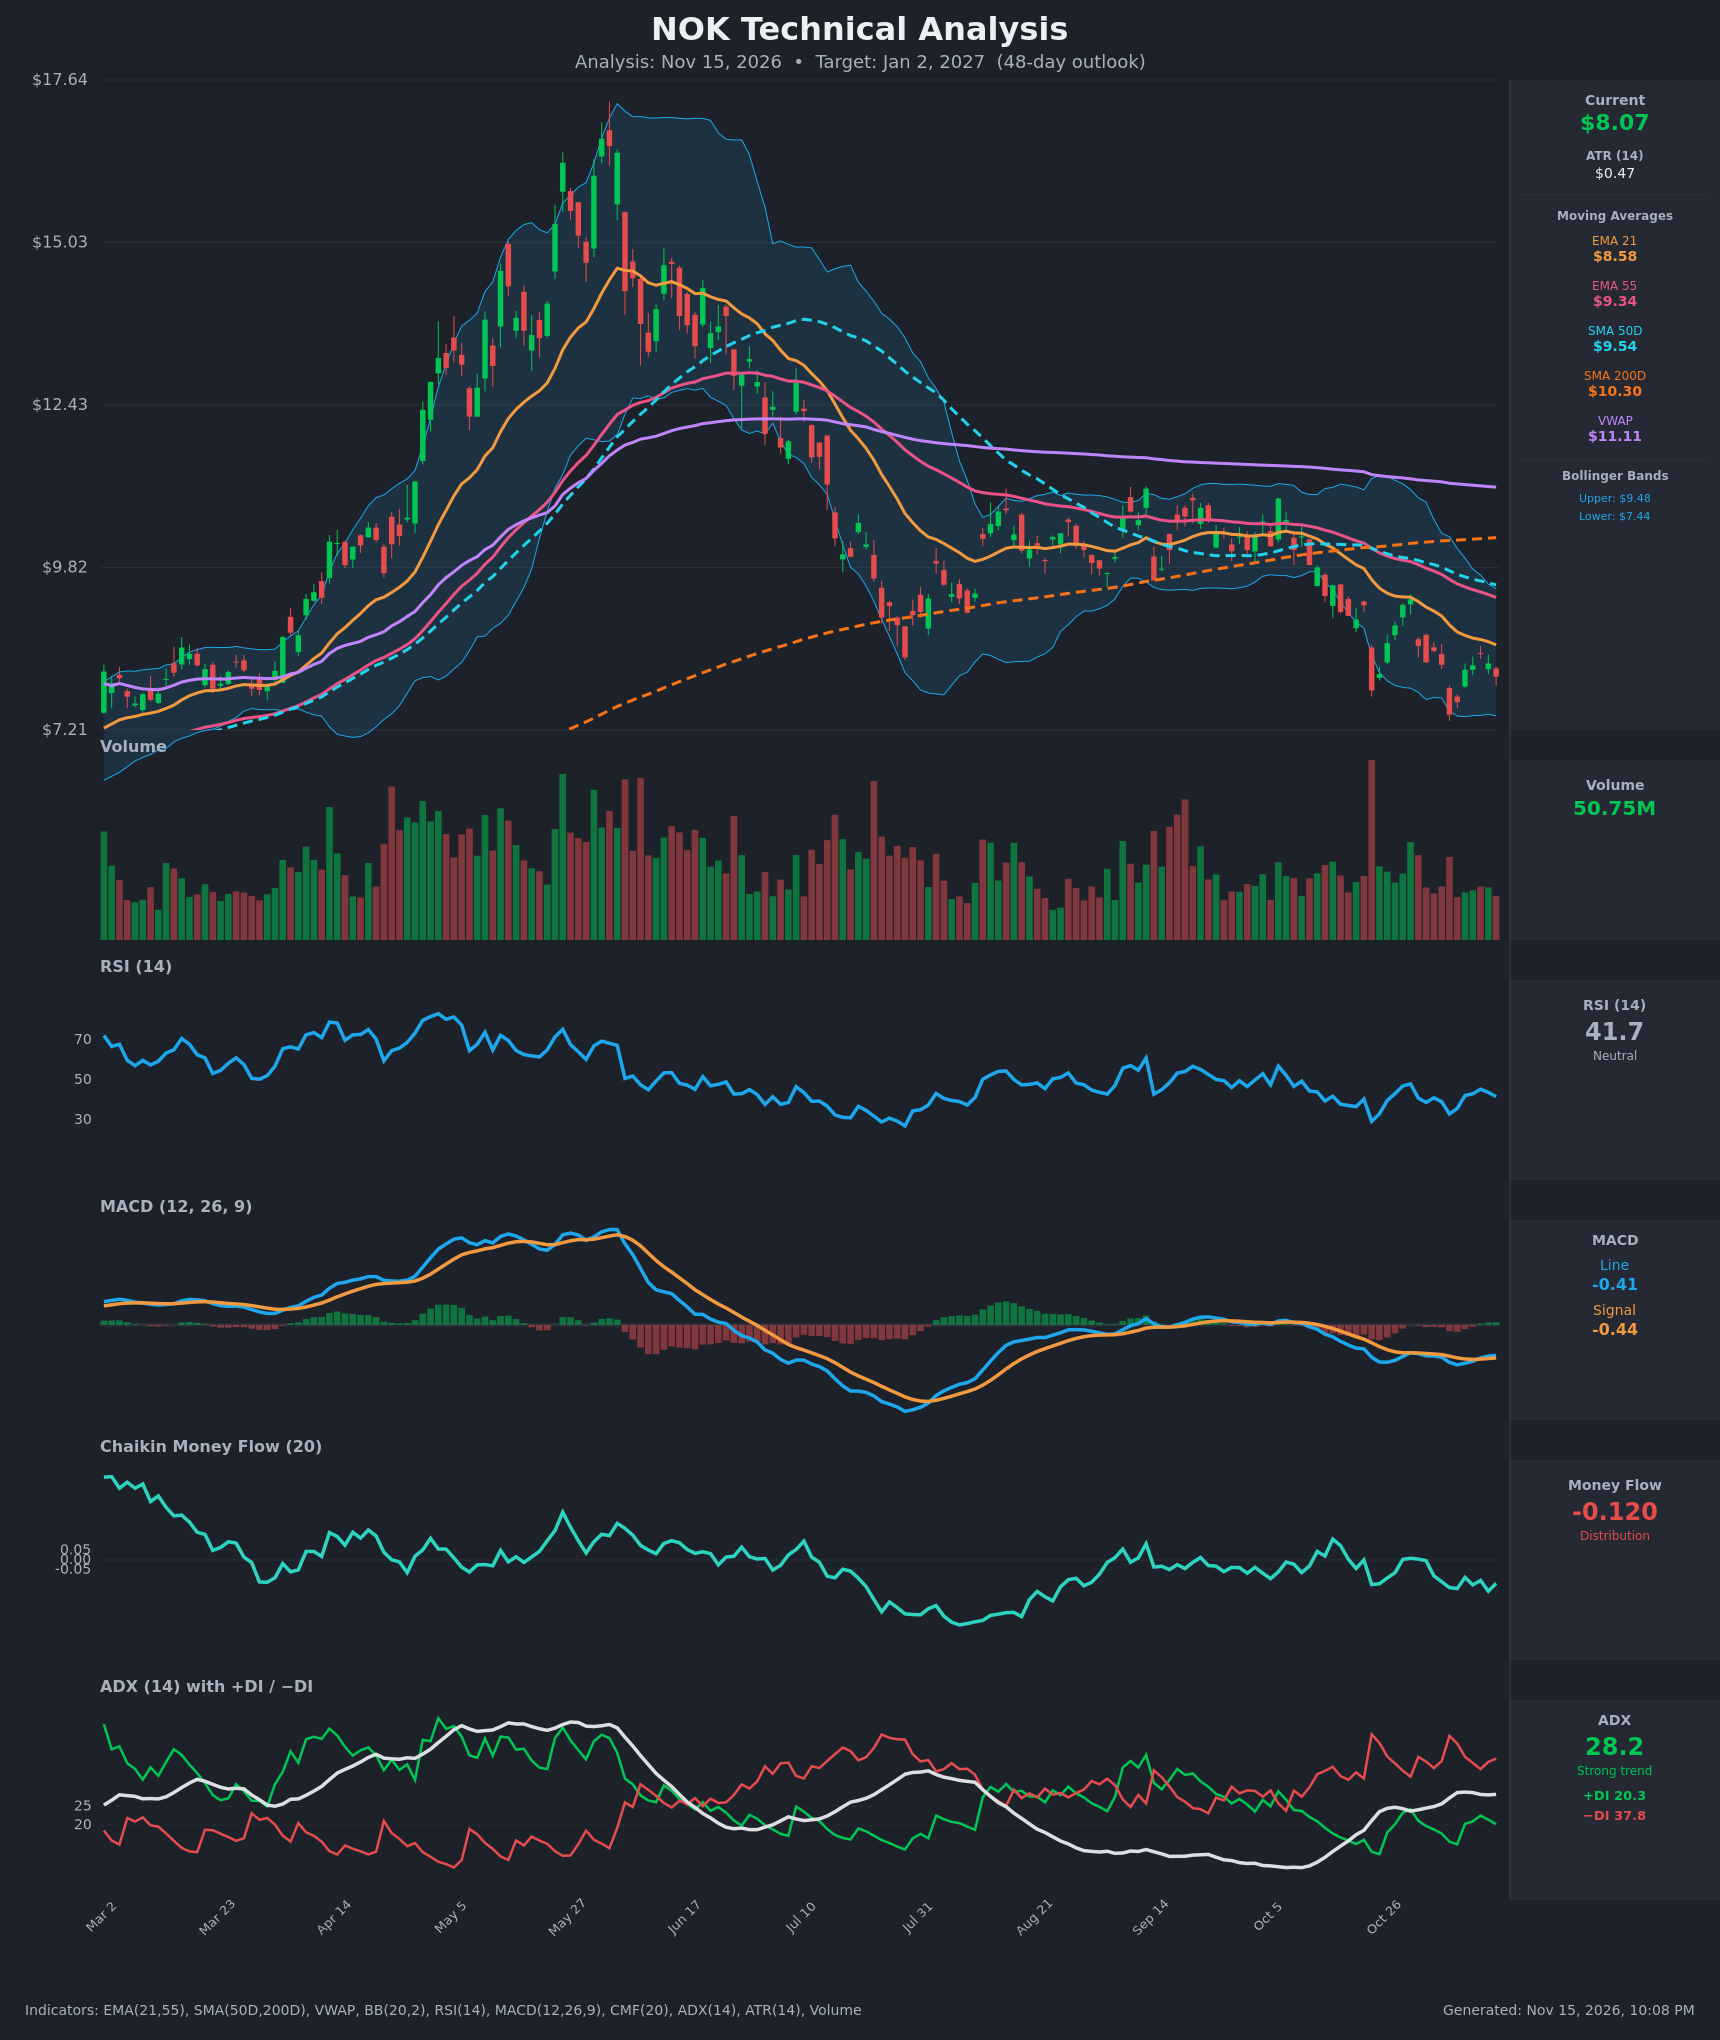
Analysis
TECHNICAL INDICATORS
- RSI (14): 41.70, below the 50 midline but well above oversold (30). It bounced from 33 on Nov 5 to 45 on Nov 11 and has rolled over again. Momentum is mildly bearish with no oversold extreme. [Bearish]
- 20 EMA (EMA 21): $8.58, with price at $8.07 about 6% below it. The EMA is falling steeply (from $9.41 on Oct 26) and acts as dynamic resistance. [Bearish]
- MACD: Line -0.409 is just above Signal -0.442, a marginal positive histogram of about +0.03. Both lines are well below zero. The line crossed back above the signal on Nov 11-12 after a bearish stretch. This is a weak, early momentum stabilization inside a downtrend, not a trend reversal. [Neutral]
- Bollinger Bands (20): Upper $9.48, lower $7.44, midline about $8.46. Price at $8.07 sits in the lower half, below the midline. It tested the lower band on Nov 5 ($7.46) and bounced. The bands are moderately wide, so there is no squeeze. [Bearish]
- CMF (20): -0.120, below the -0.05 threshold and sustained negative for most of the period. This signals distribution and persistent selling pressure on rallies. [Distribution]
- ADX (14): 28.2 and rising from the 20s, with −DI (37.8) far above +DI (20.3). The trend is strong and bearish, and the DI spread has been wide for weeks. [Strong Trend – Bearish]
- Volume: 50.75M, roughly average to slightly elevated. Heavy volume came on the early-October breakdown (large red bar) and the Nov 5 low. The recent bounce came on moderate volume, which shows no strong buying conviction. [Neutral-to-Bearish]
Moving average structure:
- Price ($8.07) is below EMA21 ($8.58), EMA55 ($9.34), SMA50D ($9.54), SMA200D ($10.30) and VWAP ($11.11). Every average is stacked overhead in bearish order.
- SMA50D has already crossed below SMA200D (the death cross is in place), and the gap between them is widening.
DIVERGENCES & TRENDS
- No bullish divergence yet. Price made a lower low on Nov 5 ($7.46) with RSI at 33, but the Nov 13 close of $8.07 comes with RSI at 41.7, so the lows are not clearly diverging.
- MACD is flat at depressed levels (near -0.41) and has not recovered, which shows stalling but not reversing momentum.
- Trend: A series of lower highs and lower lows since the May peak near $17. The bounce attempt to $9.31 on Oct 29 failed at the falling EMA21/EMA55 area.
- DI/ADX: −DI dominance with a rising ADX confirms the bears are in control.
- CMF has not recovered above zero in any meaningful way during bounces, which confirms distribution.
- Crossovers: EMA21 is well below EMA55 (bearish), the death cross is in place, and the MACD mini-cross is positive but weak.
CHART PATTERNS
- The main structure is a prolonged downtrend after a parabolic top (a large rounded top or blow-off peak around $17), followed by lower highs.
- The recent consolidation of roughly $7.46–$9.31 looks like a Bearish Flag/Pennant continuation below the 200D SMA, or a loose Descending Triangle, with support near $7.4–$7.5 tested repeatedly. A decisive break below $7.40 would target a measured move toward roughly $6.50–$6.80.
- The upside counter-case is a possible Double Bottom (Nov 5 low plus a retest). It would need a break above about $8.60–$9.30 for confirmation, which has not happened.
POTENTIAL SCENARIOS
- Scenario 1: Bearish Continuation Breakdown — The downtrend persists, with price rejected at the falling EMA21 (~$8.5) and sellers pushing it through the Nov 5 low. Trigger: daily close below $7.45 with volume. Target: $6.70–$7.00. Invalidation: daily close above $8.60 (EMA21). (50% probability)
- Scenario 2: Neutral Range-Bound Chop — Price oscillates between support near $7.45 and resistance near $8.60–$9.00 as selling pressure fades. Trigger: holds the $7.45 low with MACD flat. Target: $7.60–$8.50. Invalidation: close outside $7.40–$9.00. (28% probability)
- Scenario 3: Bullish Relief Rally / Double Bottom — Oversold bounce above EMA21 and toward SMA50D. Trigger: close above $8.60 with CMF turning positive. Target: $9.30–$9.50. Invalidation: close back below $7.80. (22% probability)
PRICE TARGETS
For the 48-day timeframe (30–60 day band, range width ~12–18%):
- Target Price: $7.55
- Expected Range: $6.60 to $8.80 (width $2.20 ≈ 27% of current price — this slightly exceeds the guide because of NOK's ATR of ~$0.47 and the strong trend; the range covers roughly 1.5 standard deviations of expected movement over 48 days)
- Key Levels: Support at $7.45, Resistance at $8.58
OVERALL BIAS
OVERALL BIAS: BEARISH - Price is below every moving average, the death cross is in place, −DI (37.8) dominates +DI (20.3) with ADX at 28 and rising, and CMF shows persistent distribution. Bounces keep failing at the falling EMA21, so a retest or break of the $7.45 support is more likely than a reclaim of $8.60.
This is educational analysis and not financial advice.