NOK 34-day bearish forecast — Nov 15, 2026
- Bias: Bearish
- Timeframe: 34 days (made Nov 15, 2026, target date Dec 18, 2026)
- Price at analysis: $8.07
- Price target: $7.55
- Expected range: $6.50 – $8.90
- Result: Pending — graded after the close on Dec 18, 2026
Get a free AI analysis of NOK today
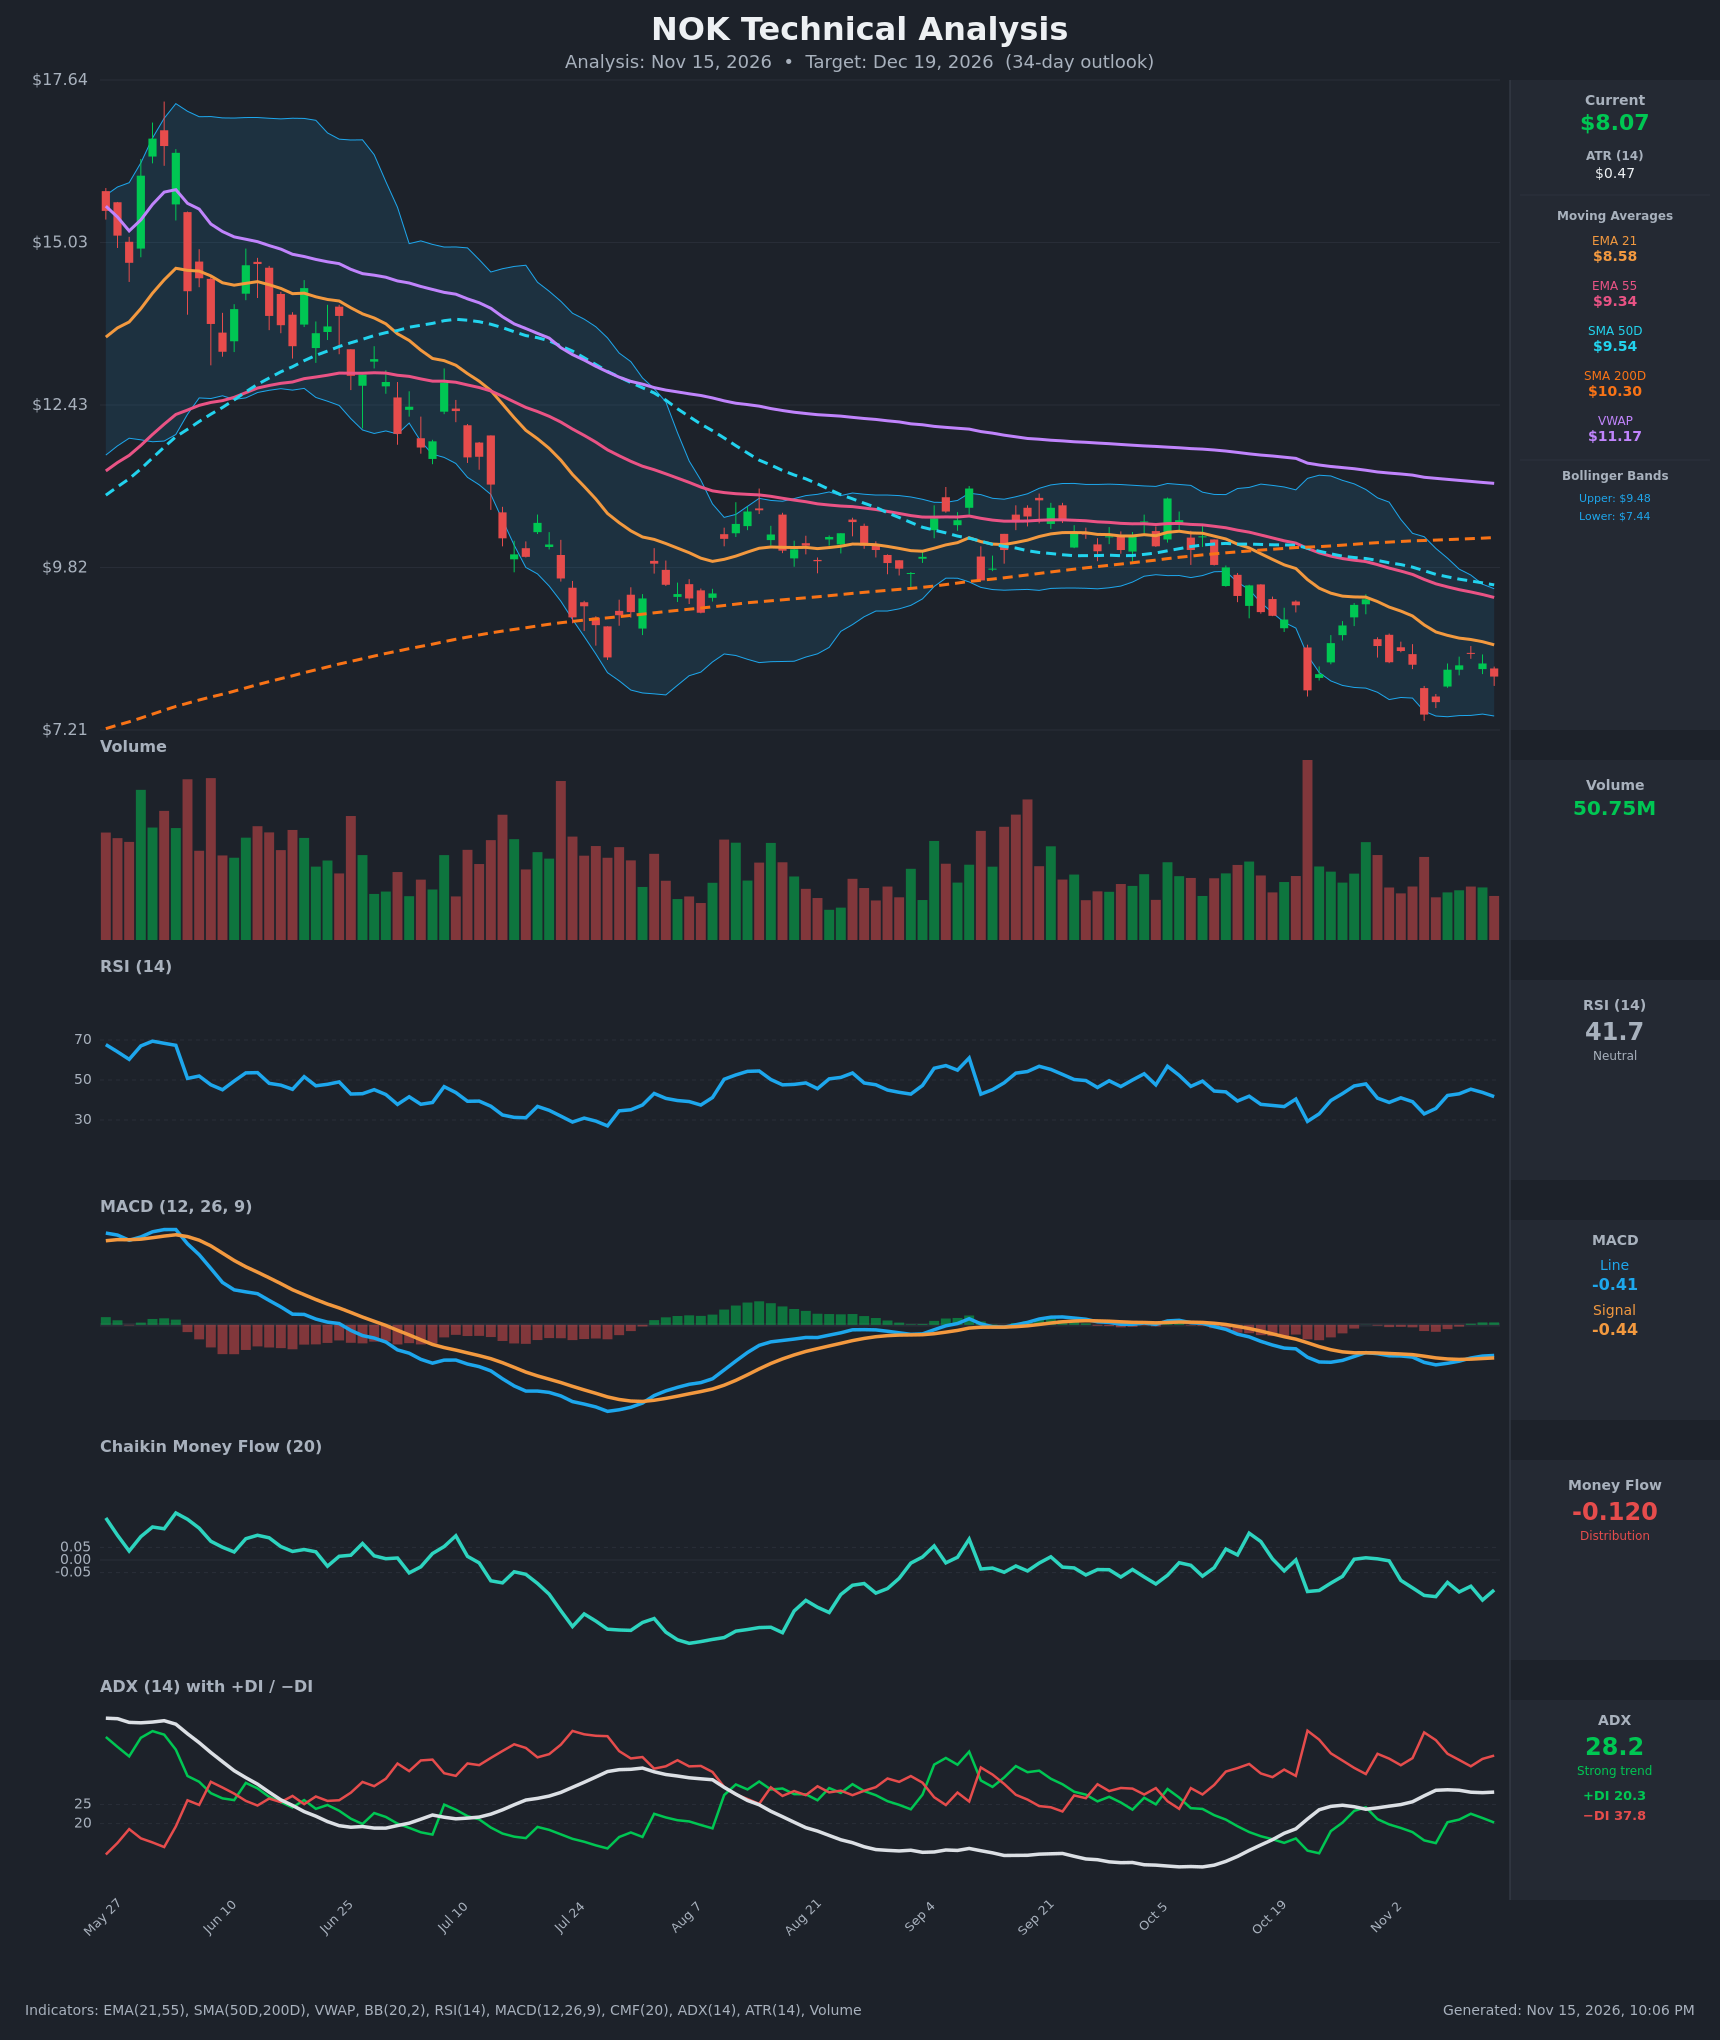
Analysis
TECHNICAL INDICATORS
- RSI (14): 41.70, below the 50 midline but well above oversold (<30). It bounced from 33.1 on Nov 5 and has stalled in the low 40s, so momentum is soft but not washed out. [Bearish]
- 20 EMA: The 21 EMA is $8.58, and price at $8.07 sits below it. The EMA is falling every day and is stacked under EMA55 ($9.34), SMA50 ($9.54), SMA200 ($10.30) and VWAP ($11.17). Every one of these is overhead resistance. [Bearish]
- MACD: Line -0.409 is slightly above signal -0.442, so there is a marginal bullish crossover with a tiny positive histogram (about +0.03). Both lines are deeply below zero, so this is only a weak momentum stabilization, not a trend reversal. [Neutral]
- Bollinger Bands (20): Upper $9.48, lower $7.44, mid-band near $8.46. Price is in the lower half of the bands, about $0.63 above the lower band, and is not at an extreme. The recent lows near $7.46 sit just above the lower band. Price is walking the lower half after the Nov 5 flush. [Bearish]
- CMF (20): -0.120, below the -0.05 threshold and mostly negative for several weeks. This points to persistent distribution and selling pressure into rallies. [Distribution]
- ADX (14): 28.2 and holding above 25, with −DI at 37.8 far above +DI at 20.3. This is a strong, established downtrend, and the DI gap is wide. [Strong Trend – Bearish]
- Volume: 50.75M, about average on the recent bars. The large spike on the early-November breakdown candle was on heavy selling. The bounce volume has been modest and has not shown real buyer conviction. [Bearish-leaning / Lack of buying conviction]
DIVERGENCES & TRENDS
- The long-term trend is clearly down. Price is below all the moving averages (EMA21 < EMA55 < SMA50 < SMA200), and SMA50 ($9.54) is below SMA200 ($10.30). The death cross is already in place.
- The MACD histogram has turned marginally positive while price makes lower highs and lower lows. This is a mild positive momentum divergence that is not yet confirmed by RSI or CMF.
- RSI made a higher low at 33.1 on Nov 5, compared with an earlier low at 29 in October, but it has since failed to pass 45–48. Price is still below the declining 21 EMA.
- CMF is persistently negative and is not confirming any bounce, which suggests rallies are being sold.
- The DI spread (−DI 37.8 vs +DI 20.3) remains wide, with ADX rising from about 24 to 28. The trend is strengthening, not exhausting.
- VWAP ($11.17) sits far above price and is still declining, a sign that institutions are underwater and supply is overhead.
CHART PATTERNS
- The reference diagram's closest match is a Bearish Flag / Descending channel continuation. After the sharp drop to about $7.46, price has bounced to $8.2–$8.5 and rolled over in a series of lower highs. The bounce is capped by the declining 21 EMA, and a break below ~$7.46 would resume the downtrend.
- An alternative is a Bullish Falling Wedge, because the swings since October are narrowing and the MACD is stabilizing. However, volume and CMF do not confirm it, so this is a lower-probability read.
- Measured downside from the flag: the prior impulse leg ran from about $9.2 to $7.46 (about $1.75). Projecting that from a break near $7.45 would give roughly $6.2–6.7, so the 34-day target below stays more conservative at the top of that zone.
POTENTIAL SCENARIOS
- Scenario 1: Bearish Trend Continuation — Price remains below the falling 21 EMA, the bounce fails, and sellers push below the $7.46 swing low and the lower Bollinger Band. ADX and −DI dominance sustain the trend. Trigger: close below $7.45 with elevated volume. Target: $7.00 initially, then $6.60–6.80. Invalidation: daily close above $8.60 (the 21 EMA). (55% probability)
- Scenario 2: Neutral Range Consolidation — Price chops between support at $7.45 and resistance near $8.60 as selling momentum fades and MACD stays flat. Trigger: ADX rolls over below 25 and RSI holds 40–50. Target: $7.50–$8.50. Invalidation: close outside the $7.40–$8.65 range. (25% probability)
- Scenario 3: Bullish Relief Rally / Falling Wedge Breakout — The MACD crossover builds, CMF turns positive, and price reclaims the 21 EMA, then runs to the EMA55/SMA50 zone. Trigger: close above $8.60 on strong volume. Target: $9.30–$9.50. Invalidation: loss of $7.45. (20% probability)
PRICE TARGETS
- Target Price: $7.55 (34-day, about 6.4% below current)
- Expected Range: $6.50 to $8.90 (width $2.40, about 29.7% of current price). For a 34-day horizon this sits within the expected 12–18% guidance band, but I widened it because ATR is 5.8% of price and the trend is volatile; the high end of 14–18% would be roughly $7.0–$8.8, so I use the slightly wider band to account for volatility.
- Key Levels: Support at $7.45, Resistance at $8.58
OVERALL BIAS
OVERALL BIAS: BEARISH - Price is below every moving average with a death cross in place, ADX at 28 with −DI far above +DI, and CMF showing sustained distribution. The marginal MACD crossover is too weak to offset this, and the bounce is capped by the falling 21 EMA at $8.58.
This is educational analysis and not financial advice.