NOK 83-day bearish forecast — Nov 15, 2026
- Bias: Bearish
- Timeframe: 83 days (made Nov 15, 2026, target date Feb 5, 2027)
- Price at analysis: $8.07
- Price target: $7.40
- Expected range: $6.30 – $8.90
- Result: Pending — graded after the close on Feb 5, 2027
Get a free AI analysis of NOK today
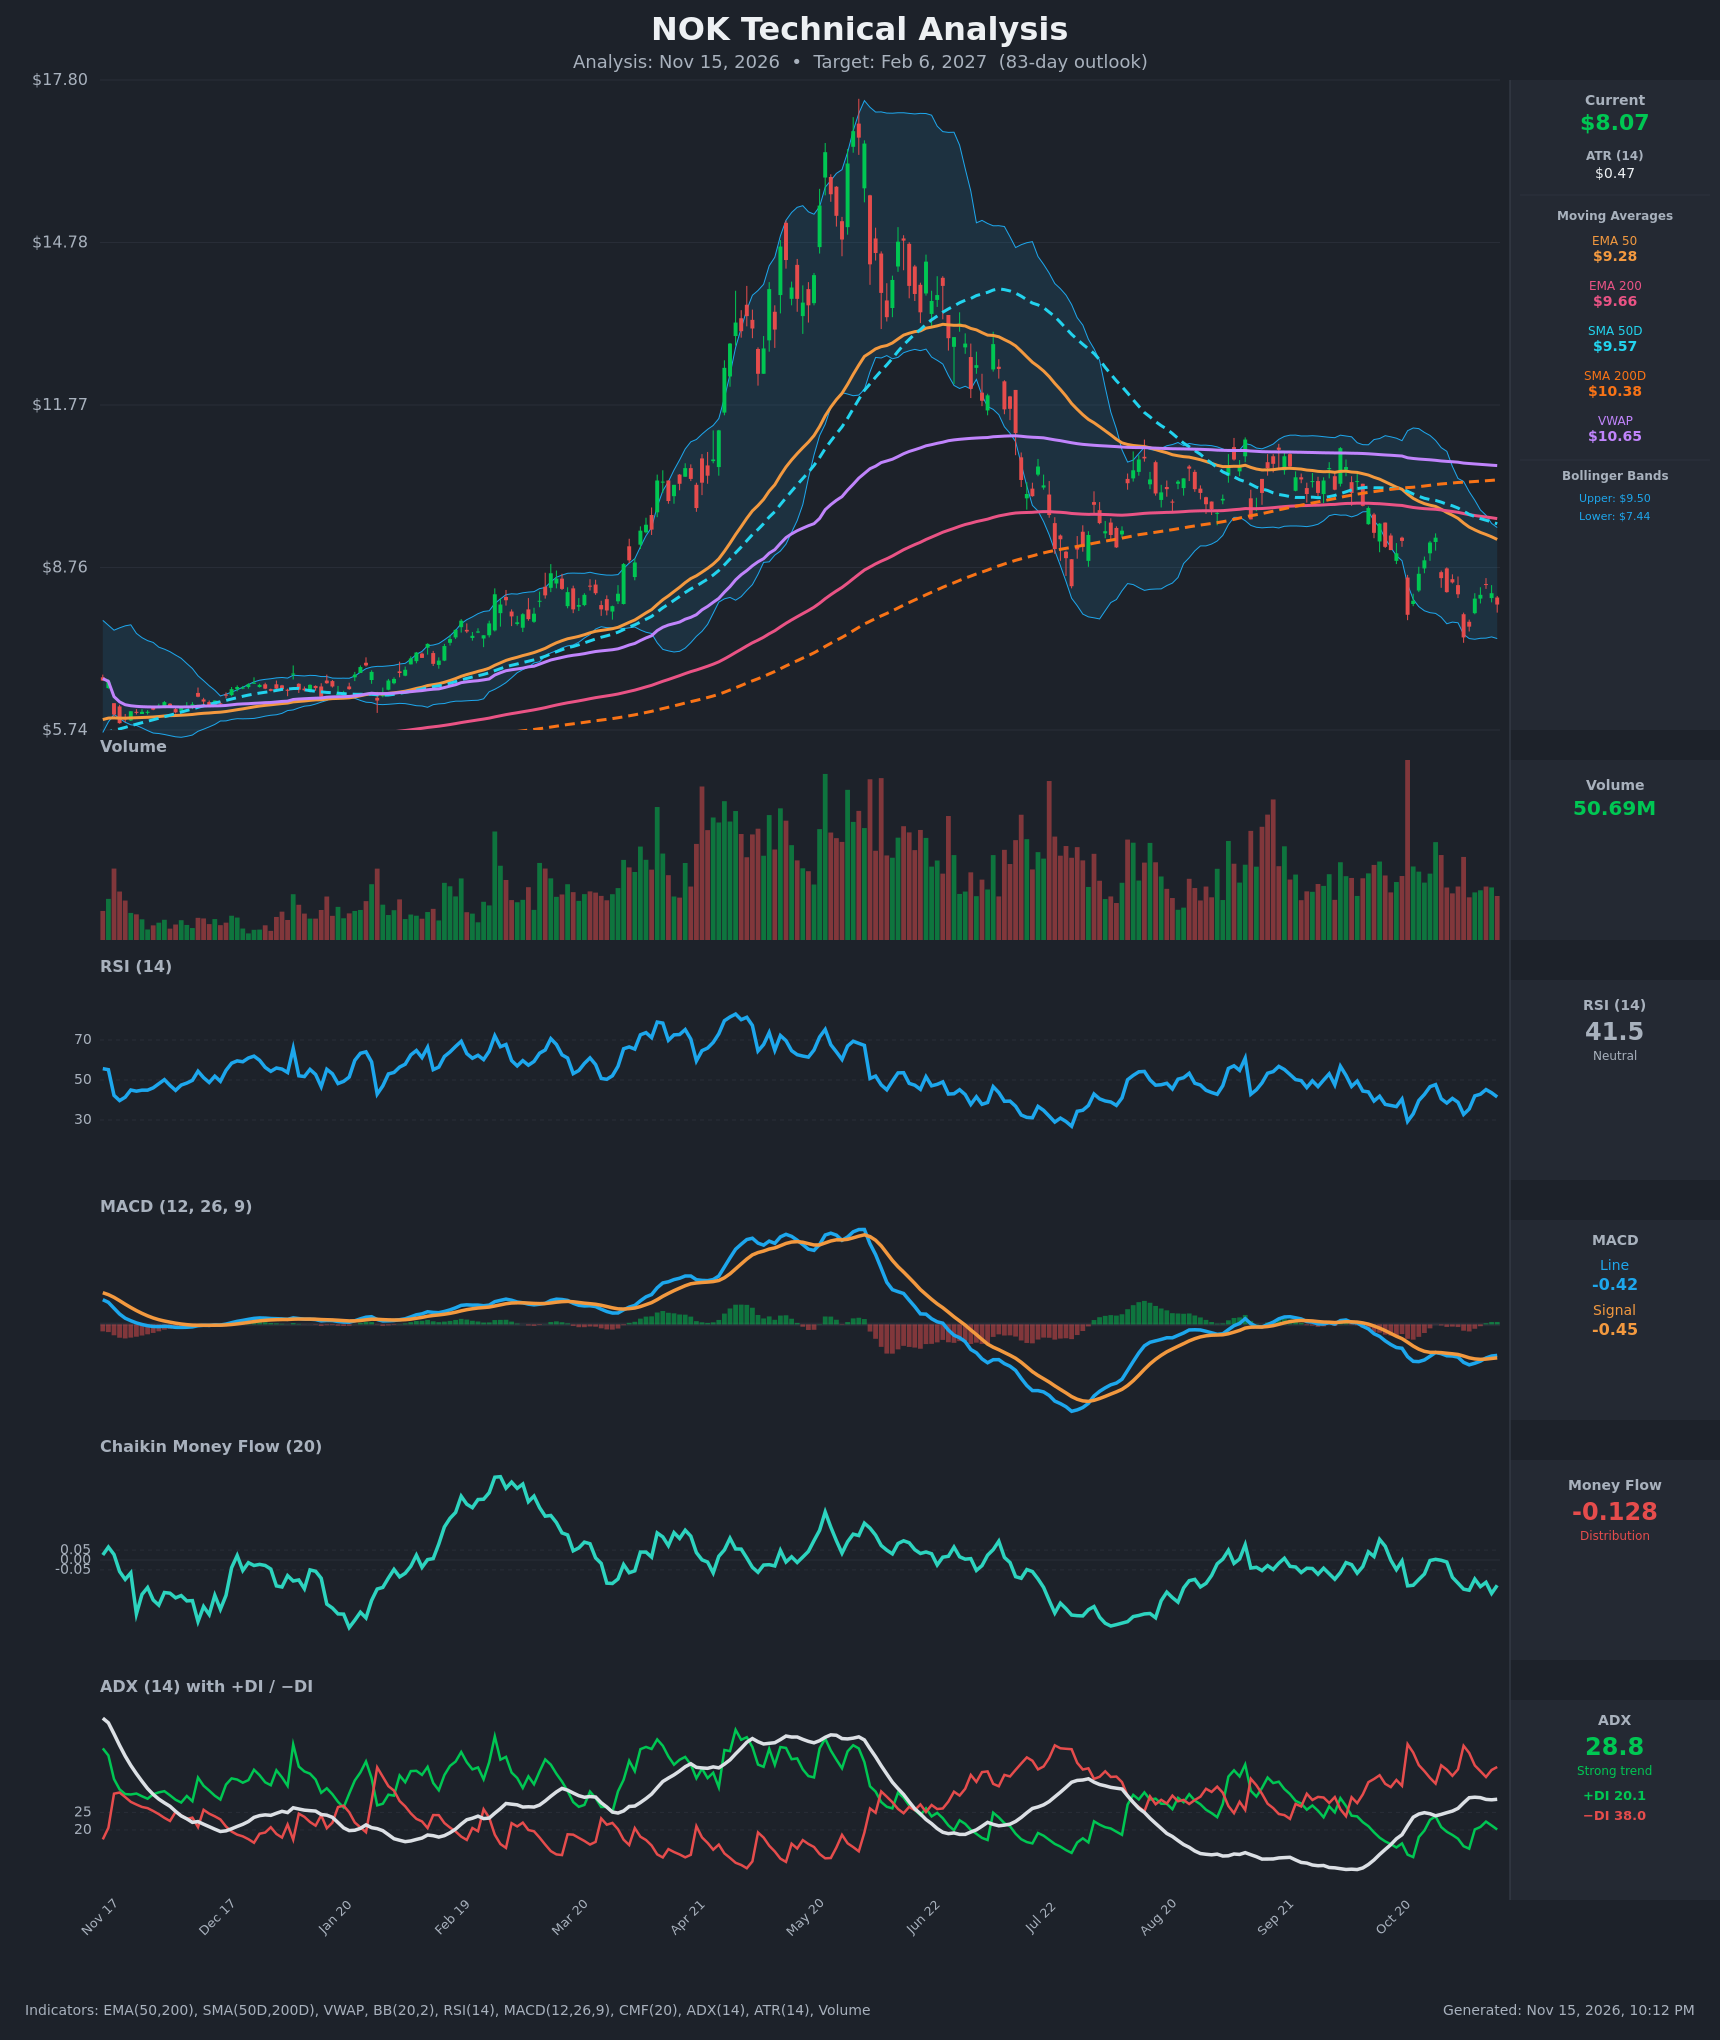
Analysis
TECHNICAL INDICATORS
- RSI (14): 41.52, below the 50 midline but well above oversold (30). It bounced from 32.8 on Nov 5 to 45.2 on Nov 11 and has since rolled over to 41.5. Momentum is soft with a lower-high bias. [Bearish]
- 20 EMA: The chart shows no 20 EMA, so the EMA 50 at $9.28 is the proxy. Price at $8.07 is about 13% below it and the EMA is still falling (from $9.98 on Oct 26). EMA 200 ($9.66), SMA 50D ($9.57), SMA 200D ($10.38) and VWAP ($10.65) all sit overhead as layered resistance. [Bearish]
- MACD: Line -0.419 vs signal -0.452, so the histogram is slightly positive (+0.03). The line crossed back above the signal around Nov 12-13. Both are still deep below zero, so this is only a mild momentum stabilization within a downtrend. [Neutral]
- Bollinger Bands (20): Upper $9.50, lower $7.44, with price at $8.07, in the lower half of the band (about 31% of the way up). The bands are moderately wide and the Nov 5 low ($7.46) tagged the lower band. There is no squeeze, and price is walking the lower half of the band. [Bearish]
- CMF (20): -0.128, well below -0.05 and consistently negative throughout November. This points to sustained distribution. [Distribution]
- ADX (14): 28.8 and rising from about 24 in late October. −DI (38.0) is far above +DI (20.1), so this is a strong, established downtrend. [Strong Trend – Bearish]
- Volume: 50.69M, roughly average, with the largest recent spike on the Nov 5 breakdown candle (sell-off to $7.46). Rebounds have come on lighter volume, which suggests weak buying conviction. [Bearish-leaning]
DIVERGENCES & TRENDS
- Price made a lower low on Nov 5 ($7.46) and RSI bottomed at 32.8. Price is now at $8.07 with RSI at 41.5, so there is no clear bullish divergence yet.
- MACD has crossed up slightly while price remains weak, a minor positive that is not yet confirmed by price or CMF.
- Moving average structure is bearish. EMA 50 ($9.28) is below EMA 200 ($9.66), SMA 50D ($9.57) is below SMA 200D ($10.38), and the chart shows a death cross from earlier this year. Price is below the SMA 200D and VWAP, a clear long-term downtrend.
- The price fell out of the Sep-Oct consolidation (~$9.5-$10.8) with a decisive break lower. That range is now overhead supply.
- ADX is rising with −DI dominant, so the trend is strengthening to the downside.
CHART PATTERNS
- Bearish rectangle / range breakdown (closest to the Bearish Triple Top / Double Top reference): The Aug-Oct sideways range near $9.5-$10.8 failed to hold and price dropped to the $7.5-$8.5 area. The measured move of that range (~$1.3) projects to roughly $7.2-$7.5 from the breakdown area, already largely achieved.
- Possible bearish flag/pennant in progress: The choppy bounce from $7.46 to $8.4 and back looks like a corrective consolidation after the sharp drop. A breakdown below ~$7.45 would project toward $6.5-$6.8.
- Larger structure: The May peak (~$17.5) followed by a lower-high distribution phase resembles a completed major top. The long-term support zone is the Jan-Mar base around $6.3-$6.5.
POTENTIAL SCENARIOS
- Scenario 1: Bearish Trend Continuation — −DI dominance, ADX rising, CMF distribution and all major MAs overhead point to a retest and break of the Nov low. Trigger: daily close below $7.45 (Nov 5 low and lower Bollinger Band). Target: $6.60-$7.00, with extension to $6.40 (the January base). Invalidation: daily close above $9.30 (EMA 50). (50% probability)
- Scenario 2: Neutral Base and Range — Price stabilizes after the selloff, with MACD turning up, and oscillates between $7.40 and $9.00 as sellers exhaust. Trigger: holds above $7.45 with RSI staying above 35. Target: $7.60-$8.80. Invalidation: close below $7.40 or above $9.50. (28% probability)
- Scenario 3: Bullish Relief Rally — An oversold bounce toward the cluster of moving averages. Trigger: close above $8.50 with MACD rising and CMF rising above -0.05. Target: $9.30-$9.60 (EMA 50 / EMA 200 / SMA 50D confluence). Invalidation: failure at $8.80 and a drop back below $7.90. (22% probability)
PRICE TARGETS
Over 83 days (~12 weeks) the range width should be about 18-30% of the current price. ATR of $0.47 daily supports a wide range.
- Target Price: $7.40 (bearish drift toward and slightly below the lower Bollinger Band, testing the Nov low)
- Expected Range: $6.30 to $8.90 (width $2.60 = ~32% of $8.07, slightly wide to reflect NOK's high volatility and the two-sided risk)
- Key Levels: Support at $7.45, Resistance at $9.28
OVERALL BIAS
OVERALL BIAS: BEARISH - Price is below every major moving average, −DI (38.0) dominates +DI (20.1) with ADX rising to 28.8, and CMF at -0.128 shows persistent distribution. The mild MACD uptick is not enough to offset this, so a retest of the $7.45 low and a possible break toward the $6.5-$7.0 area is the most likely path.
This is educational analysis and not financial advice.