NOK 20-day bearish forecast — Nov 15, 2026
- Bias: Bearish
- Timeframe: 20 days (made Nov 15, 2026, target date Dec 4, 2026)
- Price at analysis: $8.07
- Price target: $7.75
- Expected range: $7.25 – $8.20
- Result: Pending — graded after the close on Dec 4, 2026
Get a free AI analysis of NOK today
Analysis
TECHNICAL INDICATORS
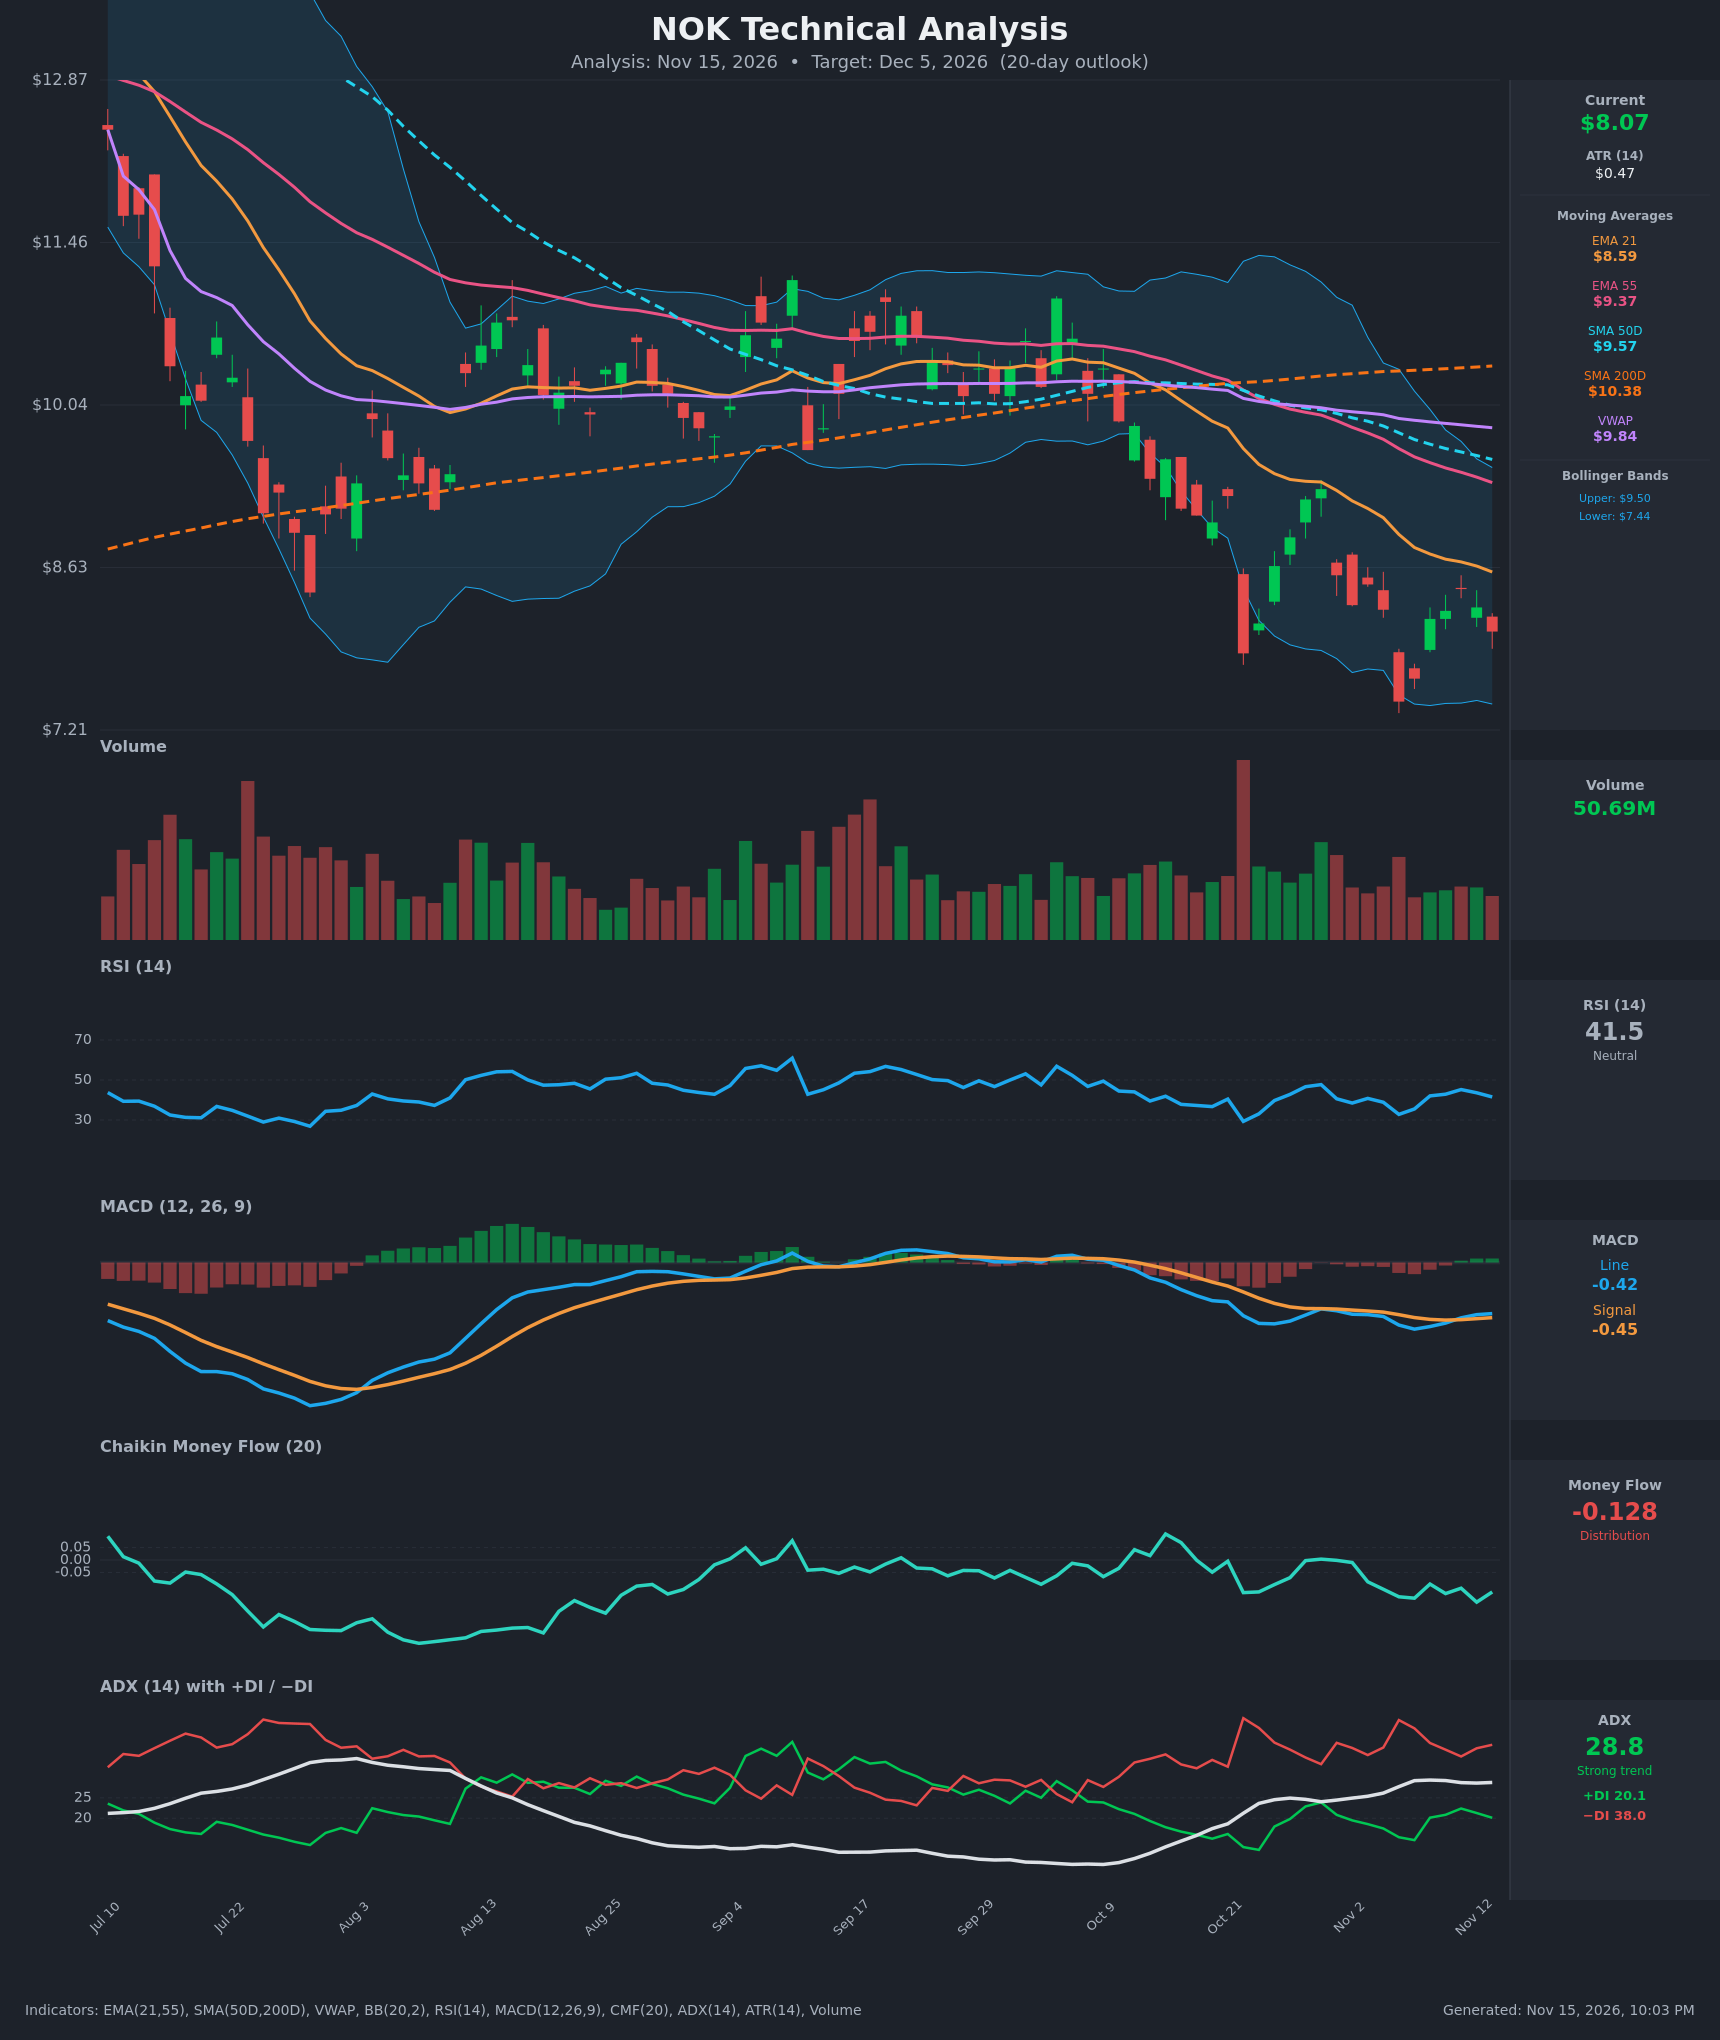
- RSI (14): 41.52, below the 50 midline but not oversold. It is down from 45.2 on Nov 11, so momentum is fading again after the bounce from 32.8 on Nov 5. There is room to fall before oversold. [Bearish]
- 20 EMA: The EMA 21 is $8.59 and price at $8.07 is below it, so it acts as dynamic resistance. The EMA 21 is also well below the EMA 55 ($9.37), a bearish alignment that has widened over the last 15 bars. Price has also been rejected under the EMA 21 on recent bounces. [Bearish]
- MACD: The line is -0.419 and the signal is -0.452. The line crossed back above the signal around Nov 11-12, so the histogram is marginally positive. Both lines are still deeply negative and below zero, so this is a weak, low-conviction momentum improvement inside a downtrend. [Neutral]
- Bollinger Bands (20): The bands are $7.44 lower and $9.50 upper, with the midline near $8.47. Price sits in the lower third, below the midline, with room before the lower band. It is not yet in oversold-extreme territory. The bands are still wide after the October selloff. [Bearish]
- CMF (20): -0.128, well below -0.05, and negative on almost every bar in the last two weeks with no sign of recovery. This is persistent distribution. [Distribution]
- ADX (14): 28.8 and slightly rising (24.5 → 28.8), above the 25 trend threshold. −DI (38.0) is far above +DI (20.1), and the gap remains wide. This is a strong, established downtrend. [Strong Trend – Bearish]
- Volume: 50.69M, roughly average. The big volume spike came on the Oct 21 breakdown, and the recent bounces have come on light volume, which suggests weak buying. There is no capitulation volume yet to signal a durable bottom. [Neutral-to-Bearish]
DIVERGENCES & TRENDS
- Bullish divergence (minor): The Nov 5 low at $7.46 had RSI at 32.8 and a MACD of -0.513. The current price of $8.07 is above that low and the MACD has turned up relative to its signal. This is a shallow momentum improvement, not a confirmed divergence.
- Moving-average structure:
- Price is below the EMA 21, EMA 55, SMA 50D ($9.57), SMA 200D ($10.38) and VWAP ($9.84).
- The SMA 50D is below the SMA 200D, so the death cross is in place and the long-term trend is down.
- Price is about 22% below the SMA 200D.
- DI trend: −DI has been above +DI throughout, with no bullish DI crossover. +DI briefly rose to 23.9 on Oct 29 but was rejected.
- MACD: The Oct 30 - Nov 6 bearish crossover/widening was followed by a marginal bullish re-cross on Nov 11-12. Since the lines are below zero, this is a weak, counter-trend signal.
- CMF: It is making lower lows and has been below zero since the October decline, which confirms selling pressure.
- Price structure: The lower highs are $9.31 (Oct 29), then $8.48, then $8.44. The lows are $7.46 and then $7.66-$8.07. Rallies keep failing under the falling EMA 21.
CHART PATTERNS
- Descending trend / lower highs (closest to Descending Triangle or Bearish Flag): Price made a sharp drop (Oct 21), then bounced and rolled over, with lower highs and support near $7.45. If $7.44-$7.46 breaks, the measured move points toward roughly $6.80-$7.00.
- Possible Bullish Double Bottom / Falling Wedge (unconfirmed): The Nov 5 low (~$7.46) and the lower Bollinger Band offer a base. This would need a close above ~$8.60 (EMA 21) and the Nov 9-11 highs to confirm, with a target near $9.30. It is currently the lower-probability pattern.
- Reference: Price is below the SMA 50D and SMA 200D, in a strong downtrend with bearish continuation characteristics.
POTENTIAL SCENARIOS
- Scenario 1: Bearish Trend Continuation — Price stays under the falling EMA 21 and retests the lower Bollinger Band and the Nov 5 low. A break of that low would extend the move on persistent distribution and a strong ADX. Trigger: rejection at $8.40-$8.60 or a close below $7.90. Target: $7.45, with an extension to $7.10-$7.25 on a break. Invalidation: a daily close above $8.60 (EMA 21) with CMF turning positive. (50% probability)
- Scenario 2: Bullish Relief Bounce / Double Bottom — Price holds the $7.45 area, the MACD histogram keeps improving, and a mean-reversion bounce takes price toward the Bollinger midline and EMA 21. Trigger: close above $8.45-$8.60 on rising volume. Target: $8.60-$9.00. Invalidation: close below $7.44. (35% probability)
- Scenario 3: Neutral Range — Price chops between $7.50 and $8.50 as the market digests the October decline. Trigger: low-volume sideways action with ADX flattening. Target: $7.80-$8.30. Invalidation: a close outside the $7.44-$8.60 range. (15% probability)
PRICE TARGETS
- Target Price: $7.75 (20-day, about -4% from current)
- Expected Range: $7.25 to $8.20 (width $0.95 ≈ 11.8% of price, consistent with the 14-21 day guidance)
- Key Levels: Support at $7.44 (lower Bollinger Band / Nov 5 low area), Resistance at $8.59 (EMA 21)
OVERALL BIAS
OVERALL BIAS: BEARISH - Price is below every moving average with a death cross in place. ADX is 28.8 with −DI far above +DI, CMF shows persistent distribution, and rallies fail below the EMA 21. The marginal MACD uptick and the proximity to the lower Bollinger Band argue for a bounce risk, so conviction is moderate.
This is educational analysis and not financial advice.