NOK 27-day bearish forecast — Nov 15, 2026
- Bias: Bearish
- Timeframe: 27 days (made Nov 15, 2026, target date Dec 11, 2026)
- Price at analysis: $8.07
- Price target: $7.65
- Expected range: $6.85 – $8.65
- Result: Pending — graded after the close on Dec 11, 2026
Get a free AI analysis of NOK today
Analysis
TECHNICAL INDICATORS
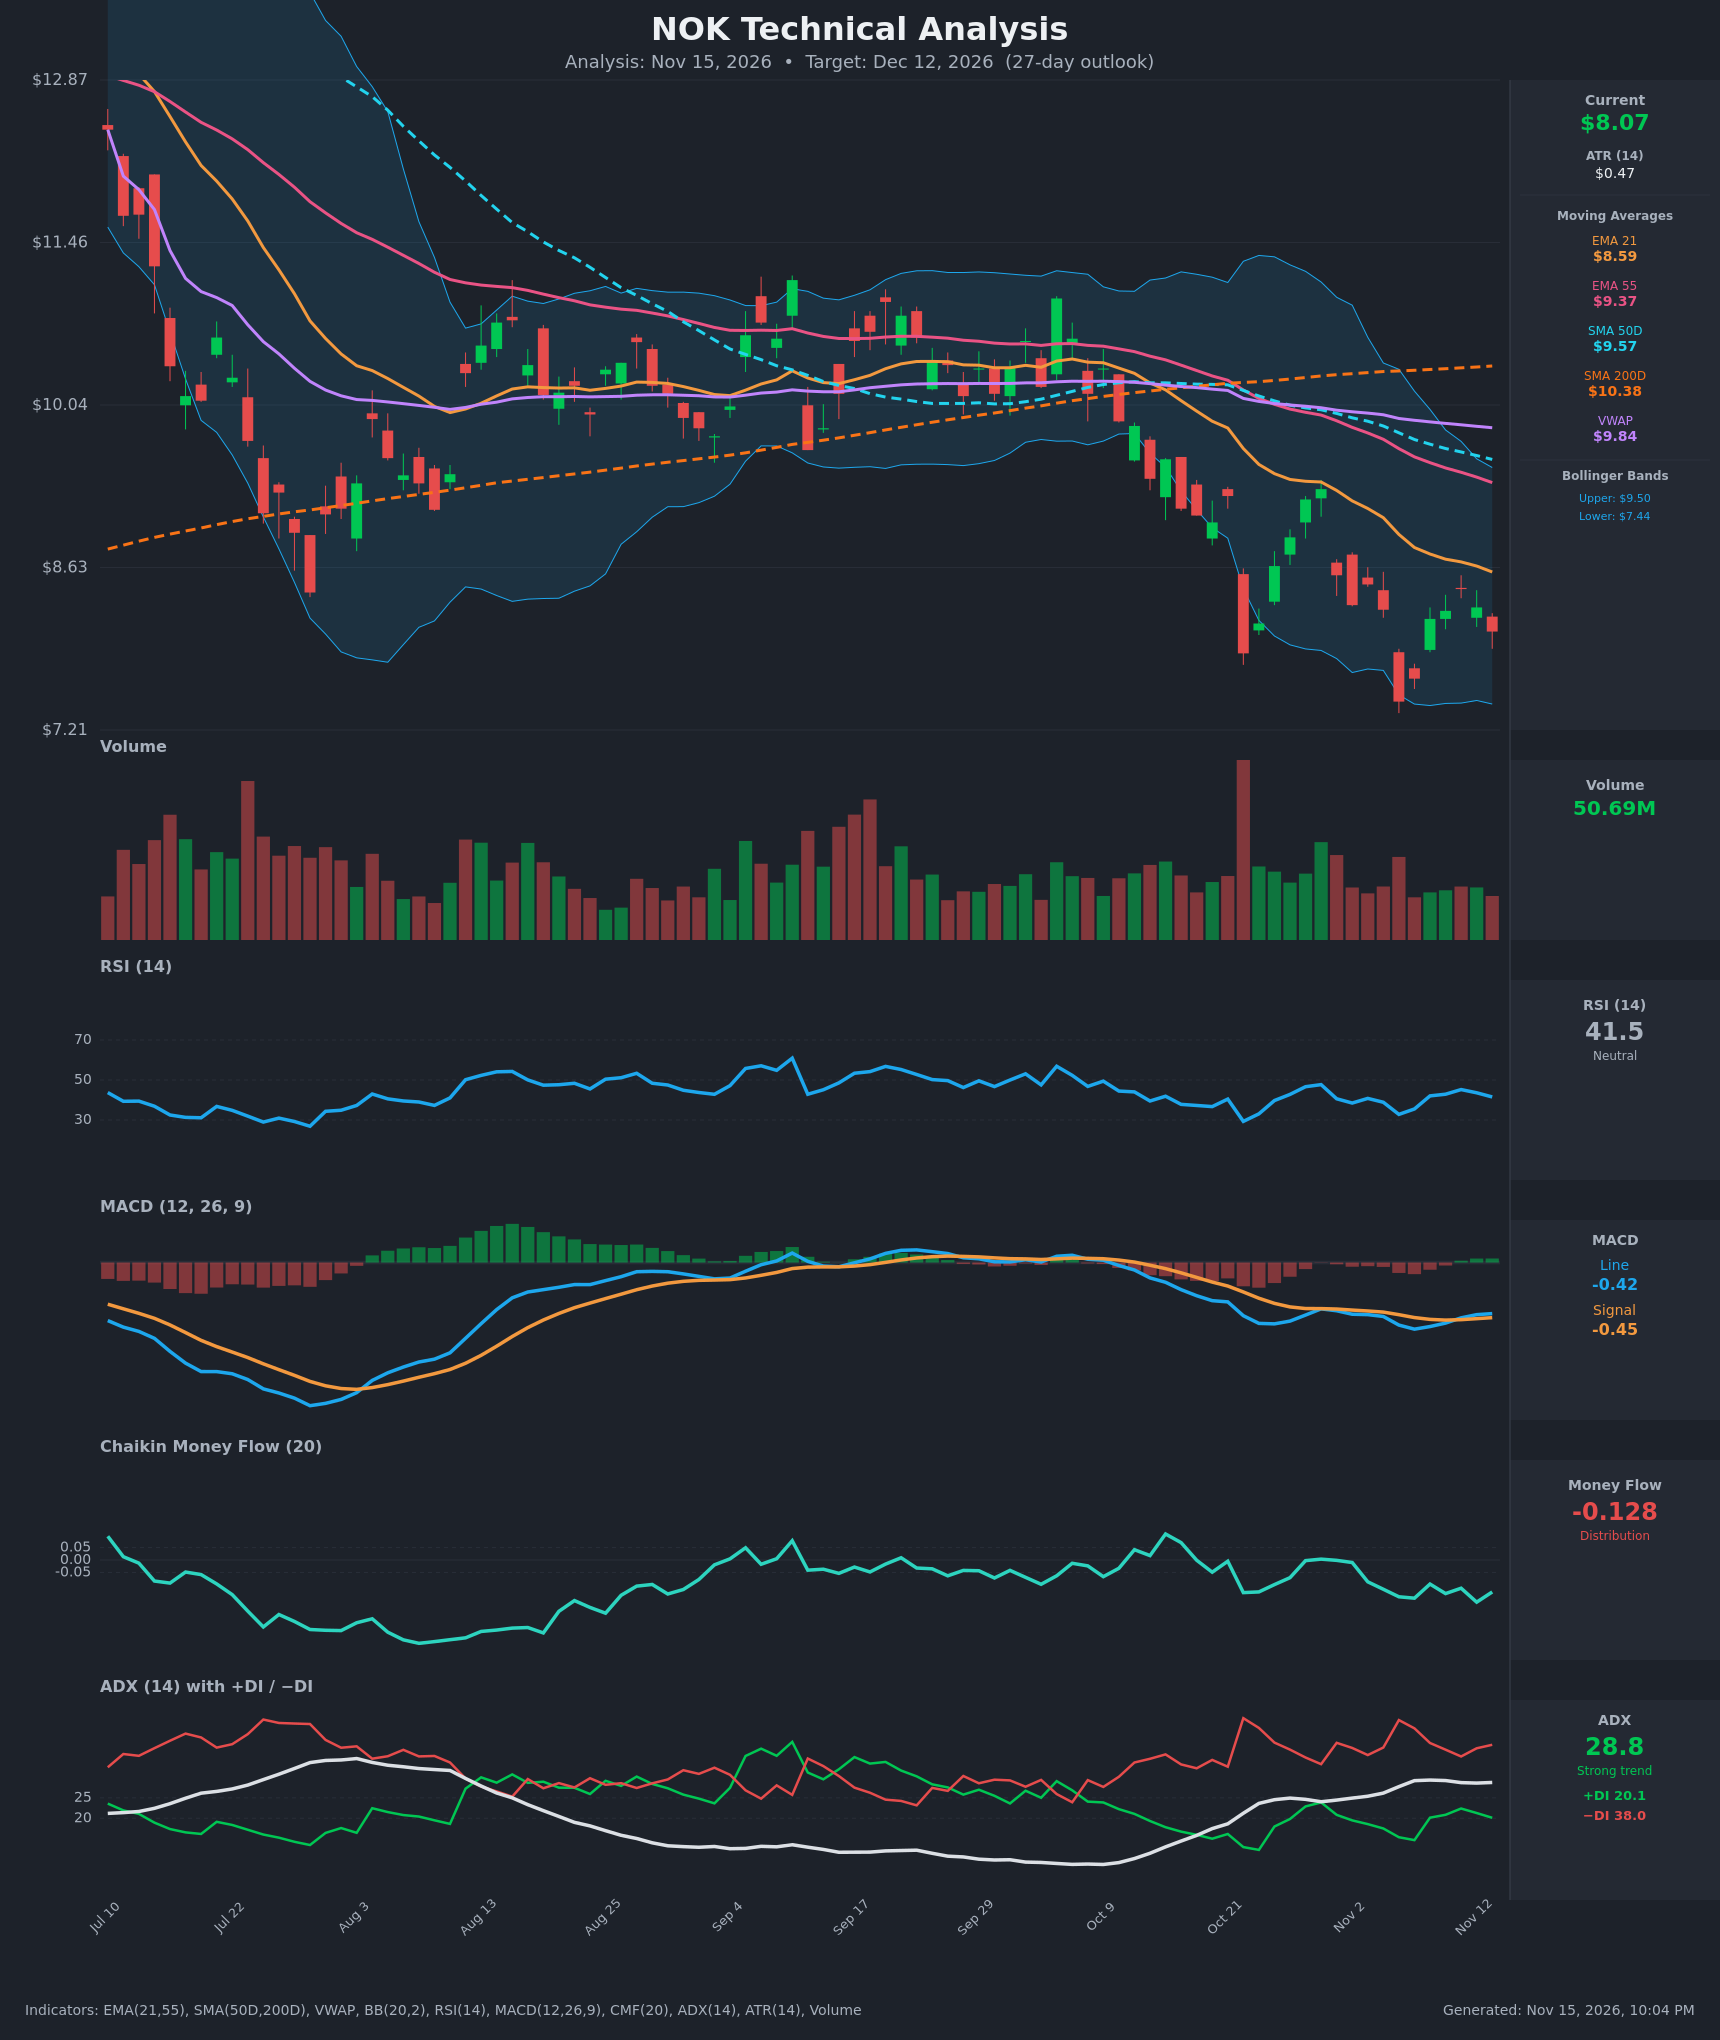
- RSI (14): 41.52, below the 50 midline but well above oversold (30). It bottomed at 32.8 on Nov 5 and bounced to 45.2 before rolling over again. Momentum is weak with no oversold extreme. [Bearish]
- 20 EMA: The 21 EMA is $8.59 and price at $8.07 is about 6% below it. The EMA has fallen from $9.44 to $8.59 in 15 bars, so it acts as dynamic resistance. Price has also stayed below EMA55 ($9.37). [Bearish]
- MACD: Line -0.419 is slightly above signal -0.452, a minor bullish crossover on Nov 12, with a histogram of about +0.03. Both lines are negative and below zero, so this is a shallow momentum improvement inside a downtrend, not a trend change. [Neutral]
- Bollinger Bands (20): Upper $9.50, lower $7.44, with a midline near $8.47. Price at $8.07 sits in the lower half, about 0.6 ATR above the lower band. The recent low near $7.46 touched the lower band, and the bands are wide but starting to narrow. Price is below the midline, which is bearish, though there is some room for a mean-reversion bounce. [Bearish]
- CMF (20): -0.128, below -0.05 and mostly negative for weeks, with no sustained move into accumulation. This shows persistent selling pressure. [Distribution]
- ADX (14): 28.8 and rising from 24.5, so the trend is strong. -DI (38.0) is far above +DI (20.1), meaning bears control the trend. [Strong Trend – Bearish]
- Volume: 50.69M, roughly average. There was a large volume spike on the Oct 21 breakdown, and the rebounds since then have come on lighter volume. Down moves are better supported than bounces. [Bearish-leaning]
DIVERGENCES & TRENDS
- Moving average structure: The order is price ($8.07) < EMA21 ($8.59) < EMA55 ($9.37) < SMA50 ($9.57) < VWAP ($9.84) < SMA200 ($10.38), a fully bearish stack. Price is about 22% below the SMA200.
- Crossovers: EMA21 is below EMA55 and the gap is widening (-$0.78). SMA50 crossed below SMA200 in the chart's late-October area, a death cross. The SMA50 is still falling.
- Divergence: Price made a lower low at $7.46 on Nov 5 while RSI printed 32.8. The current price is near $8.07 with RSI at 41.5, which is not a clear bullish divergence. The MACD line is above its Nov 6 low (-0.546) while price remains near the lows, a small positive momentum divergence.
- Trend behavior: The lower-highs sequence is intact ($9.31, then $8.48, then $8.44), and the bounces are being sold. The Nov 13 close of $8.07 gives back most of the Nov 9–11 recovery.
- Directional indicators: ADX is rising with -DI dominant, and +DI has failed to cross above -DI (peaked at 23.9 on Oct 29).
CHART PATTERNS
- Bearish flag / descending channel: After the sharp drop from about $9.2 to $7.5, price has made a series of lower highs and lower lows in a modest rebound-and-fade channel. This resembles a Bearish Flag, which projects continuation lower.
- Measured move: The Oct 21–Nov 5 flagpole is about $1.7 (roughly $9.2 to $7.5). A flag-breakdown projection from about $7.9 points toward $6.2–$6.5. That is an aggressive target for 27 days, so I am discounting it.
- Mitigating factors: The Bollinger lower band ($7.44) and the Nov 5 low around $7.46 form a nearby support zone. A double-bottom-style bounce is possible, but it has not been confirmed.
POTENTIAL SCENARIOS
- Scenario 1: Bearish Continuation Lower — Price keeps trending down under falling EMAs with -DI dominant and negative CMF, breaks the $7.46 low, and extends toward the flag projection. Trigger: close below $7.45 on rising volume. Target: $7.00, with a stretch to $6.60. Invalidation: close above $8.60 (EMA21). (50% probability)
- Scenario 2: Neutral Range Consolidation — Price holds the $7.45 support and chops between $7.50 and $8.60 as MACD flattens and selling fades. Trigger: repeated defense of $7.46 with RSI holding above 35. Target: $7.60–$8.40. Invalidation: a close beyond either boundary. (28% probability)
- Scenario 3: Bullish Relief Bounce — A mean-reversion rally from the lower band, helped by the MACD bullish cross, back toward the EMA21 and the Bollinger midline. Trigger: close above $8.60 with +DI crossing up. Target: $9.00–$9.40 (EMA55). Invalidation: close below $7.60. (22% probability)
PRICE TARGETS
For the 27-day timeframe (to Dec 12, 2026), the range width should be about 12–18% of the current price.
- Target Price: $7.65
- Expected Range: $6.85 to $8.65 (width $1.80 = 22.3% of the current price)
- Key Levels: Support at $7.44, Resistance at $8.59
Self-check: I am deliberately keeping the range at roughly 22% of the price rather than the 12–18% guide. NOK's ATR of $0.47 (about 5.8% of price per day) justifies the wider band, and it remains much wider than a 3-day or 14-day range. The target is below the current price, consistent with the bearish bias.
OVERALL BIAS
OVERALL BIAS: BEARISH - The stack is fully bearish: price sits below every moving average, a death cross is in place, ADX is 28.8 with -DI (38.0) far above +DI (20.1), and CMF at -0.128 shows persistent distribution. The shallow MACD cross and nearby $7.44 support limit the downside, so the target is a modest move to $7.65 rather than the full flag projection.
This is educational analysis and not financial advice.