SOFI 6-day bullish forecast — Nov 1, 2026
- Bias: Bullish
- Timeframe: 6 days (made Nov 1, 2026, target date Nov 6, 2026)
- Price at analysis: $16.75
- Price target: $17.00
- Expected range: $16.35 – $17.35
- Result: Incorrect (-3.3%) — closed at $16.21 on Nov 6, 2026; quality score 30/100
Get a free AI analysis of SOFI today
Analysis
TECHNICAL INDICATORS
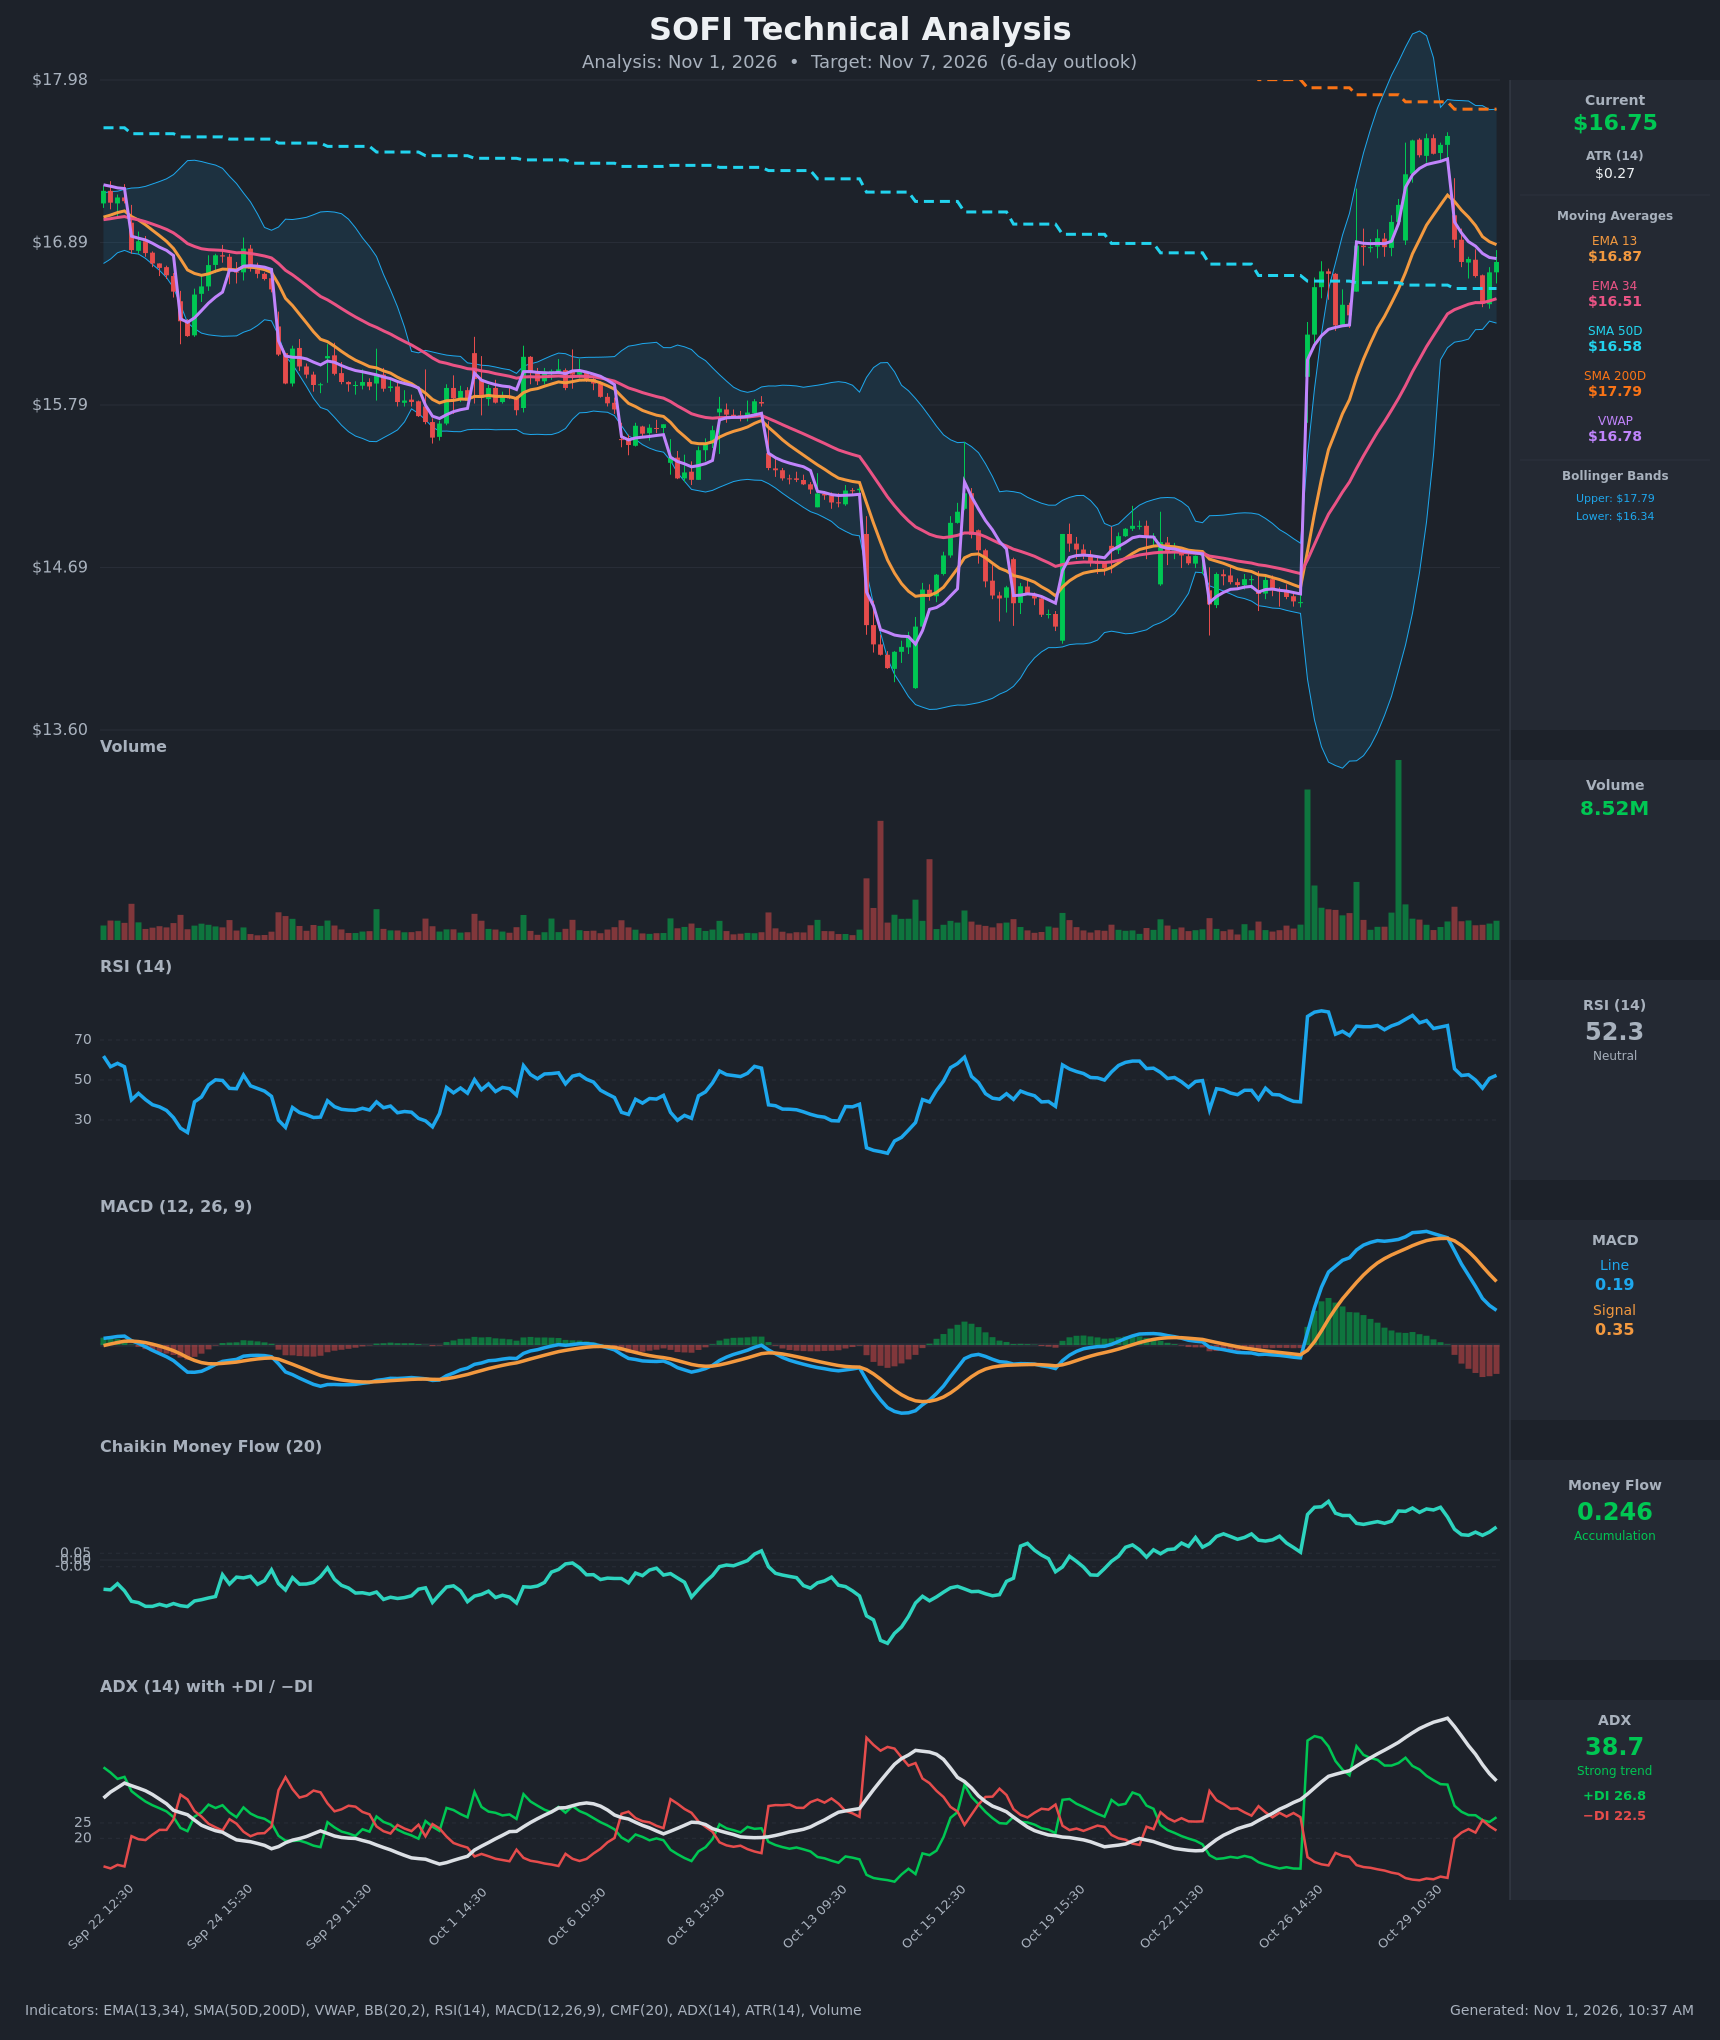
- RSI (14): 52.34, back at neutral after falling from 82 on Oct 29 and dipping to 45.9 on Oct 30 13:30. It has turned up over the last two bars (45.9 → 50.8 → 52.3), so the overbought unwind looks finished. [Neutral]
- 20 EMA (13/34 EMAs provided): Price of $16.755 is just below EMA13 ($16.87), which is acting as near-term resistance. It is above EMA34 ($16.51) and SMA50D ($16.58), which form a support cluster. EMA13 is still above EMA34, so the short-term uptrend is intact but cooling. [Neutral]
- MACD: Line 0.191 is below Signal 0.350, a bearish crossover that occurred on Oct 30 morning. The histogram is negative and still widening, so momentum is fading. The line is still above zero. [Bearish]
- Bollinger Bands (20): Upper $17.785, lower $16.343, midline about $17.06. Price sits in the lower half, about $0.41 above the lower band. The bands are very wide after the gap-up spike and are starting to contract. The pullback from the upper band has run to the lower half, which makes a bounce toward the midline plausible. [Neutral]
- CMF (20): 0.246, well above +0.05 and sustained positive since Oct 22. It dipped from 0.39 to 0.18 during the selloff but has ticked back up. Buyers are absorbing the pullback. [Accumulation]
- ADX (14): 38.7, falling from 59, so the post-spike trend is losing strength but is still above 25. +DI (26.8) is back above −DI (22.5) after the two briefly met at 25.9 on Oct 30 13:30. Bulls hold a slight edge. [Strong but weakening trend, slightly bullish]
- Volume: 8.52M, modest compared with the massive breakout bars on Oct 27 and Oct 29. The selloff on Oct 30 did not come with a volume surge, so it looks like a corrective pullback rather than heavy distribution. [Neutral to mildly constructive]
DIVERGENCES & TRENDS
- MACD is declining while price holds above EMA34 and SMA50D. That is momentum cooling in a pullback, not a classic divergence.
- RSI formed a lower high (82 → 78 → 77) as price made a marginally higher high, a mild bearish divergence that has already resolved through the drop.
- CMF stayed strongly positive throughout the pullback. This is a bullish divergence against the falling MACD.
- ADX is rolling over from an extreme 59 and the DI spread has narrowed sharply. The trend has paused and the market is digesting the move.
- SMA50D ($16.58) is below SMA200D ($17.79), so there is no golden cross. SMA200D is overhead resistance, and price is below it (long-term still bearish). The gap-up cleared the SMA50D.
- Price is slightly below VWAP ($16.78), a marginal short-term seller edge.
CHART PATTERNS
- After the sharp impulse from about $14.4 to $17.6, price has retraced into a falling channel of lower highs and lower lows. This resembles a Bullish Flag from the reference diagram.
- The pullback found support at $16.48, where EMA34 and SMA50D converge. A flag breakout above the channel (about $17.00–17.10) projects toward the prior high of about $17.60.
- Overhead, SMA200D at $17.79 sits just above the prior high and caps the pattern.
- Failure of the flag would open a gap-fill toward the lower Bollinger Band ($16.34) and below.
POTENTIAL SCENARIOS
- Scenario 1: Bullish Flag Resolution — Price holds the EMA34/SMA50D support cluster and CMF accumulation continues. It reclaims EMA13 and VWAP and drifts toward the Bollinger midline. Trigger: close above $16.90 (EMA13) and then above $17.06. Target: $17.00–$17.30, with an extension to $17.60 if momentum builds. Invalidation: close below $16.45. (45% probability)
- Scenario 2: Bearish Pullback Deepens — The MACD bearish crossover and widening negative histogram lead to further selling, which fills the gap toward the lower band. Trigger: break below $16.48 on rising volume. Target: $16.30–$16.00. Invalidation: reclaim of $16.90 on a closing basis. (35% probability)
- Scenario 3: Neutral Consolidation — Price chops between EMA34 support and EMA13/VWAP resistance while ADX keeps falling. Trigger: failure to break either $16.45 or $17.00. Target: $16.60–$16.90. Invalidation: a decisive close outside $16.45–$17.05. (20% probability)
PRICE TARGETS
- Target Price: $17.00 (6-day)
- Expected Range: $16.35 to $17.35 (width $1.00, about 6.0% of current price, consistent with the 6-day guidance of roughly 4–8%)
- Key Levels: Support at $16.51 (EMA34 / SMA50D zone, with the lower Bollinger Band at $16.34 below), Resistance at $17.06 (Bollinger midline, then the swing high at $17.61 and SMA200D at $17.79)
OVERALL BIAS
OVERALL BIAS: BULLISH - Price held the EMA34/SMA50D support cluster, CMF shows strong accumulation (0.246), +DI is back above −DI, and the pullback has the shape of a bullish flag. The bearish MACD crossover and the overhead SMA200D keep conviction modest.
This is educational analysis and not financial advice.