SOFI 27-day bearish forecast — Nov 15, 2026
- Bias: Bearish
- Timeframe: 27 days (made Nov 15, 2026, target date Dec 11, 2026)
- Price at analysis: $15.42
- Price target: $14.90
- Expected range: $13.90 – $16.20
- Result: Pending — graded after the close on Dec 11, 2026
Get a free AI analysis of SOFI today
Analysis
TECHNICAL INDICATORS
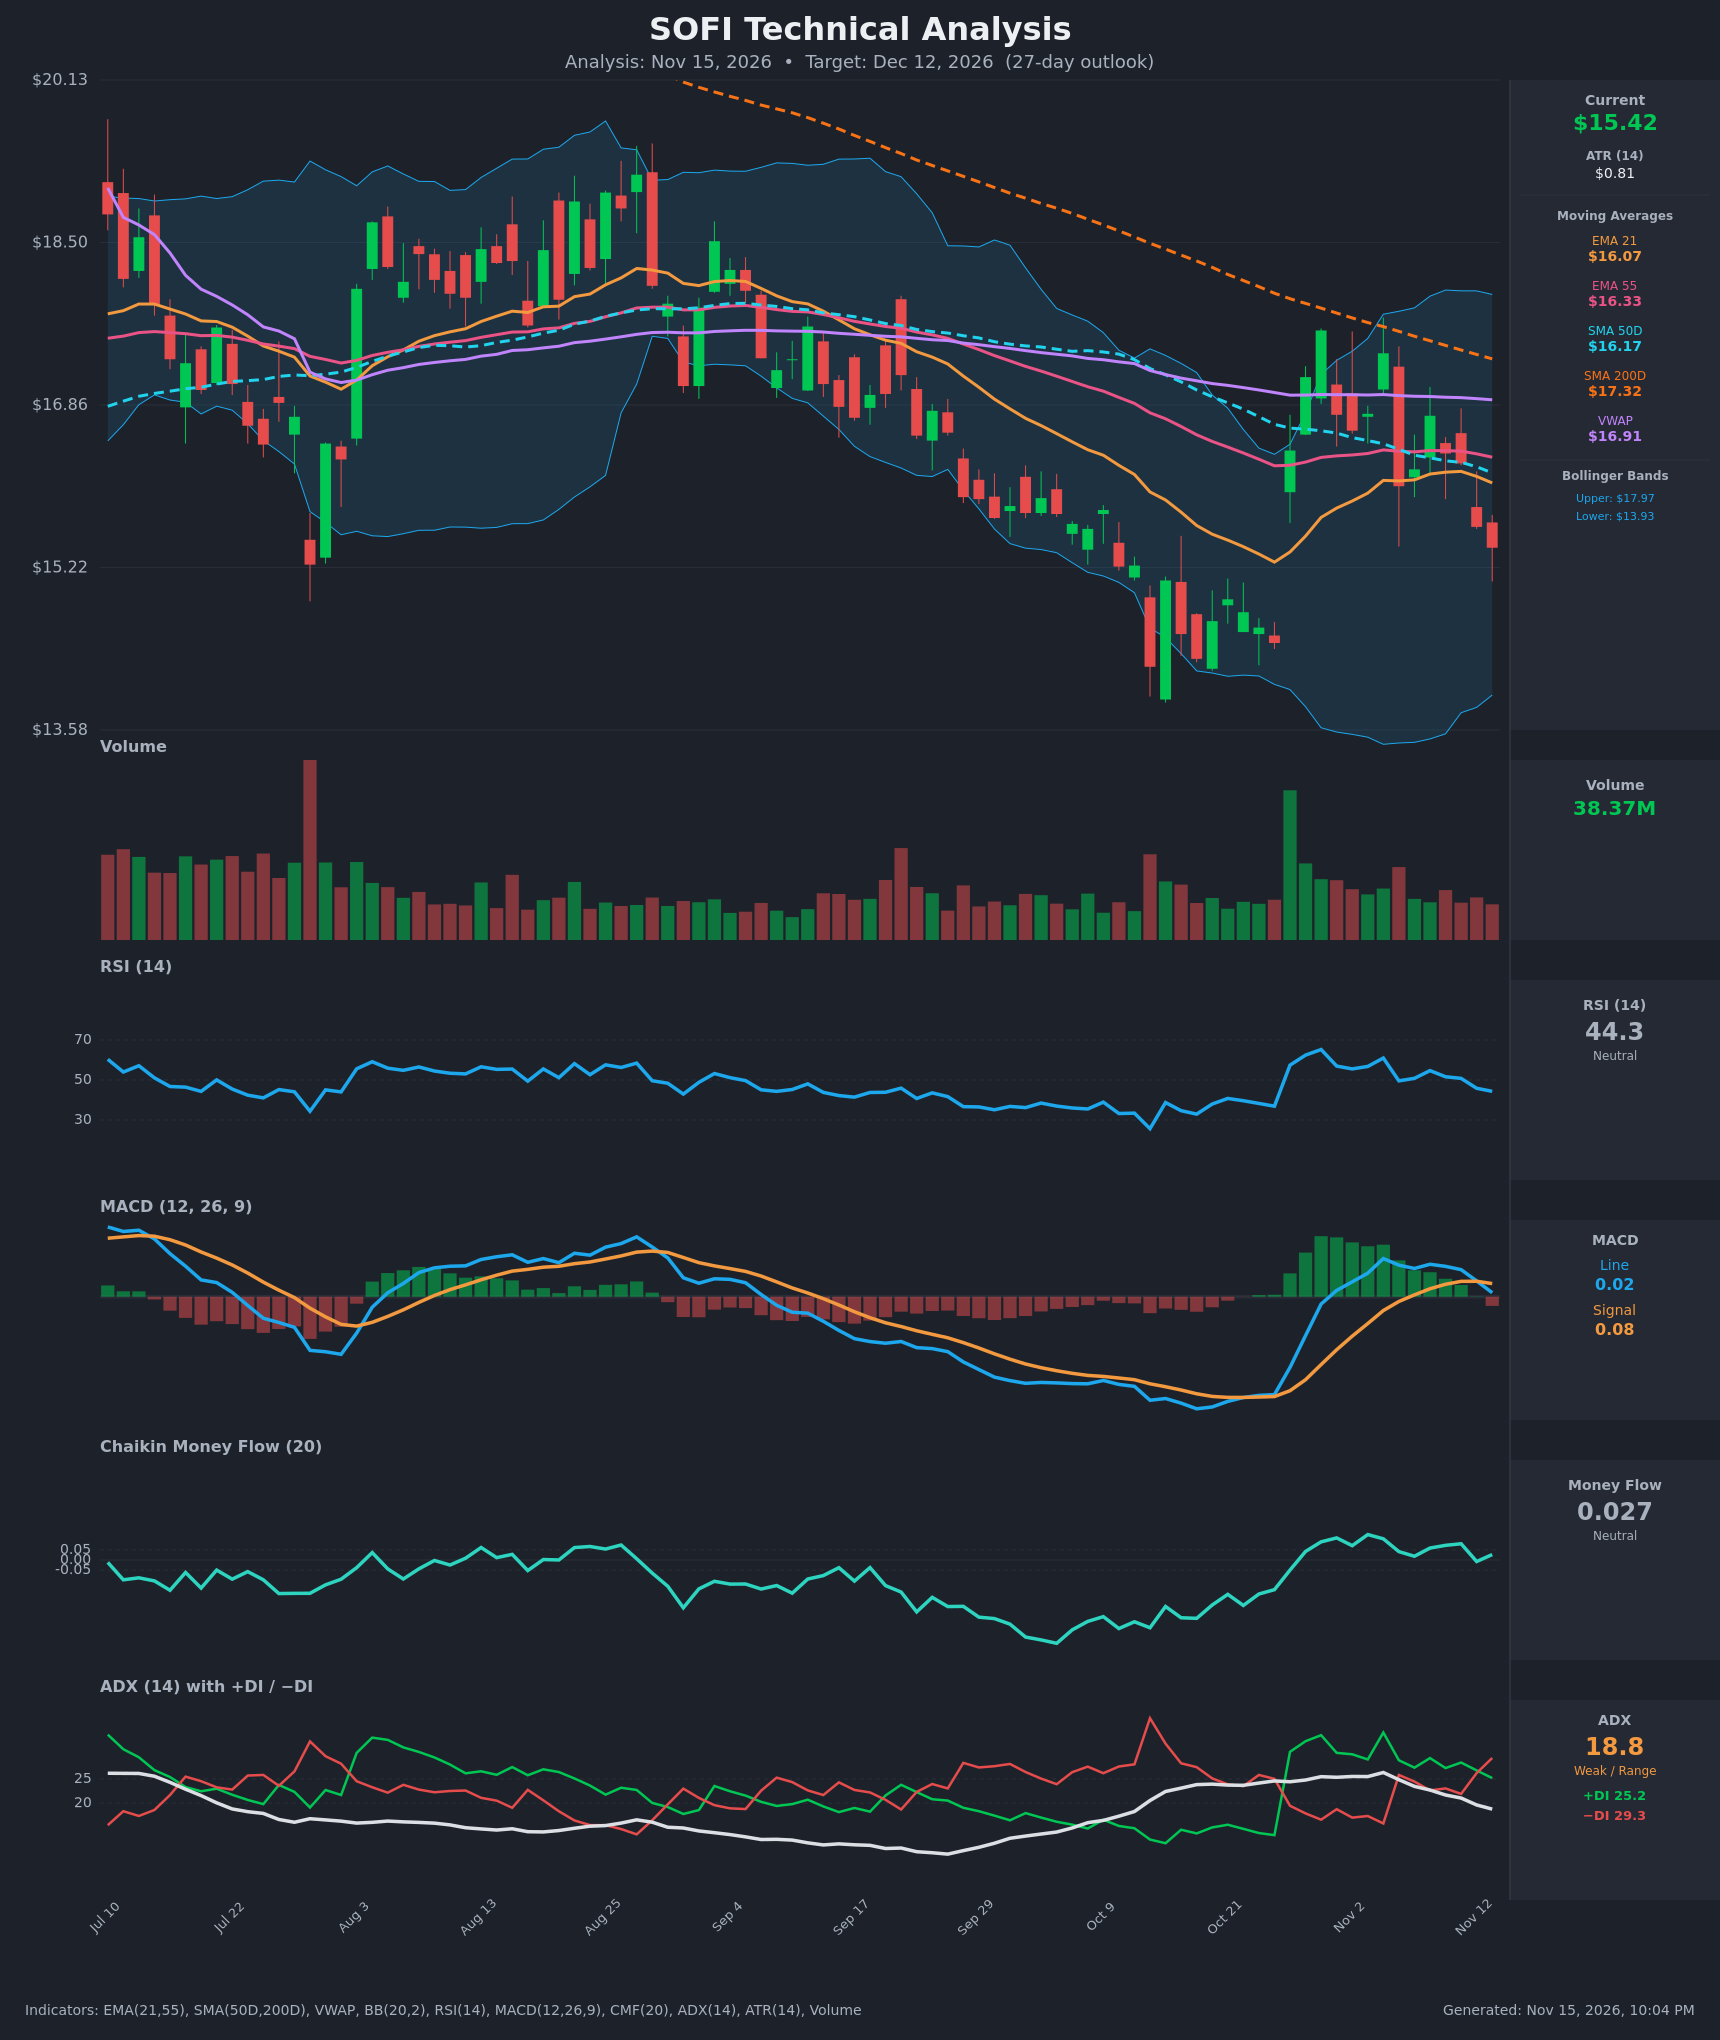
- RSI (14): 44.33, down from 61 on Nov 4 and 54.7 on Nov 9. It is below the 50 midline and falling, but well above oversold (30). Momentum is fading without being stretched. [Bearish]
- 20 EMA: The 21 EMA is $16.07 and price at $15.42 is about 4% below it. The 21 EMA is now rolling over and sits above price, so it acts as resistance. The 21 EMA is also below the 55 EMA ($16.33). [Bearish]
- MACD: The line (0.024) crossed back below the signal (0.080) on Nov 13, a fresh bearish crossover. The histogram has turned negative after a month of fading positive bars, and the line is heading back toward zero. [Bearish]
- Bollinger Bands (20): Upper $17.97, lower $13.93, so the bands are wide. Price at $15.42 sits in the lower-middle part of the band, below the midline (about $15.95). It is not at an extreme, and the Oct 21 low near the lower band marks the key support area. [Neutral]
- CMF (20): 0.027, inside the ±0.05 neutral zone. It recovered from deeply negative readings in September–October but has flattened and slipped from 0.126 on Nov 3. Accumulation has faded. [Neutral]
- ADX (14): 18.8 and falling, so there is no strong trend. −DI (29.3) has crossed back above +DI (25.2), giving bears a modest edge. This is range-like conditions with a slight bearish tilt. [Weak Trend, bearish lean]
- Volume: 38.37M, in line with the typical or slightly lower recent range. The latest red candles are on average volume, with no capitulation spike. The only big volume bar was the Oct 27 rally (+13%), and that bounce has since been given back. [Neutral to mildly bearish]
DIVERGENCES & TRENDS
- No clear divergence. RSI and MACD are both making lower highs since Nov 4, in line with price's lower highs ($17.61 → $17.38 → $16.75).
- The MACD bearish crossover on Nov 13 and the −DI/+DI flip back to bearish on Nov 12–13 confirm the fade of the late-October rally.
- Price has dropped below the 21 EMA, the 55 EMA, the 50D SMA ($16.17) and VWAP ($16.91). All are overhead resistance.
- Death cross status: the 50D SMA ($16.17) is far below the 200D SMA ($17.32), so the long-term trend remains down. The 200D is declining (the orange dashed line on the chart) and capped each rally.
- The Oct 27–29 spike through the 21 EMA failed to hold and gave back much of its gain, which is a classic failed breakout.
- ADX is falling from about 26 to 18.8, so trend energy is draining and the market is consolidating.
CHART PATTERNS
- The broad structure since August is a downtrend of lower highs and lower lows, a descending channel under the declining 200D SMA. The Oct 21 low (~$13.9) and the Oct 29 high ($17.61) form a wide range.
- From the Oct 27 reaction high, price is forming a Bearish Flag/Rising Wedge-like drift: lower highs near $17.4 and $16.75, with the latest candles breaking below the prior consolidation near $16. A loose resemblance to a Bearish Pennant also fits the compression after the spike.
- The October base near $14–14.5 is a rough Bullish Double Bottom attempt, with a neckline near $17.5. That neckline was rejected on Oct 29 and Nov 4, so the pattern is not confirmed.
- Targets: breaking the base would point to a retest of $14.0–14.5, and a failure there would open $13.5. On the upside, a reclaim of $16.3–16.9 is needed to repair the structure.
POTENTIAL SCENARIOS
- Scenario 1: Bearish Retest of the October Lows — Failed rally, MACD cross down, price below all major MAs and −DI on top. Sellers push price back toward the lower Bollinger Band and the Oct low area. Trigger: daily close below $15.20 (the recent swing support). Target: $14.40, with an extension to $13.95. Invalidation: close above $16.35 (EMA 55 and 21 EMA zone). (50% probability)
- Scenario 2: Neutral Range Chop — ADX is below 20 and CMF is flat, so price oscillates between $14.80 and $16.40 without a trend. Trigger: holds $15.00 support with RSI stabilizing near 40–45. Target: $15.30–$15.80. Invalidation: close below $14.80 or above $16.60. (28% probability)
- Scenario 3: Bullish Rebound to the Moving Averages — Oversold bounce with positive CMF turns, reclaiming the 21 EMA and 50D SMA. Trigger: close above $16.30 with volume above 45M. Target: $16.90 (VWAP), extension to $17.50. Invalidation: close back below $15.20. (22% probability)
PRICE TARGETS
For the 27-day horizon (about 12–18% range width for 30–60 days; 27 days sits slightly below that, so about 12–14%):
- Target Price: $14.90
- Expected Range: $13.90 to $16.20 (width $2.30 = about 14.9% of price; the range allows the Oct low retest on one side and a rebound toward the 21 EMA on the other)
- Key Levels: Support at $14.40, Resistance at $16.17
OVERALL BIAS
OVERALL BIAS: BEARISH - Price is below every major moving average and VWAP with the 200D SMA still declining. MACD has just crossed down, −DI is back above +DI, and RSI is falling below 50, while the late-October rally has failed at the declining 200D, so a drift back toward the $14–14.5 support area is more likely than a recovery.
This is educational analysis and not financial advice.