SOFI 48-day bearish forecast — Nov 15, 2026
- Bias: Bearish
- Timeframe: 48 days (made Nov 15, 2026, target date Jan 1, 2027)
- Price at analysis: $15.42
- Price target: $14.60
- Expected range: $13.30 – $15.90
- Result: Pending — graded after the close on Jan 1, 2027
Get a free AI analysis of SOFI today
Analysis
TECHNICAL INDICATORS
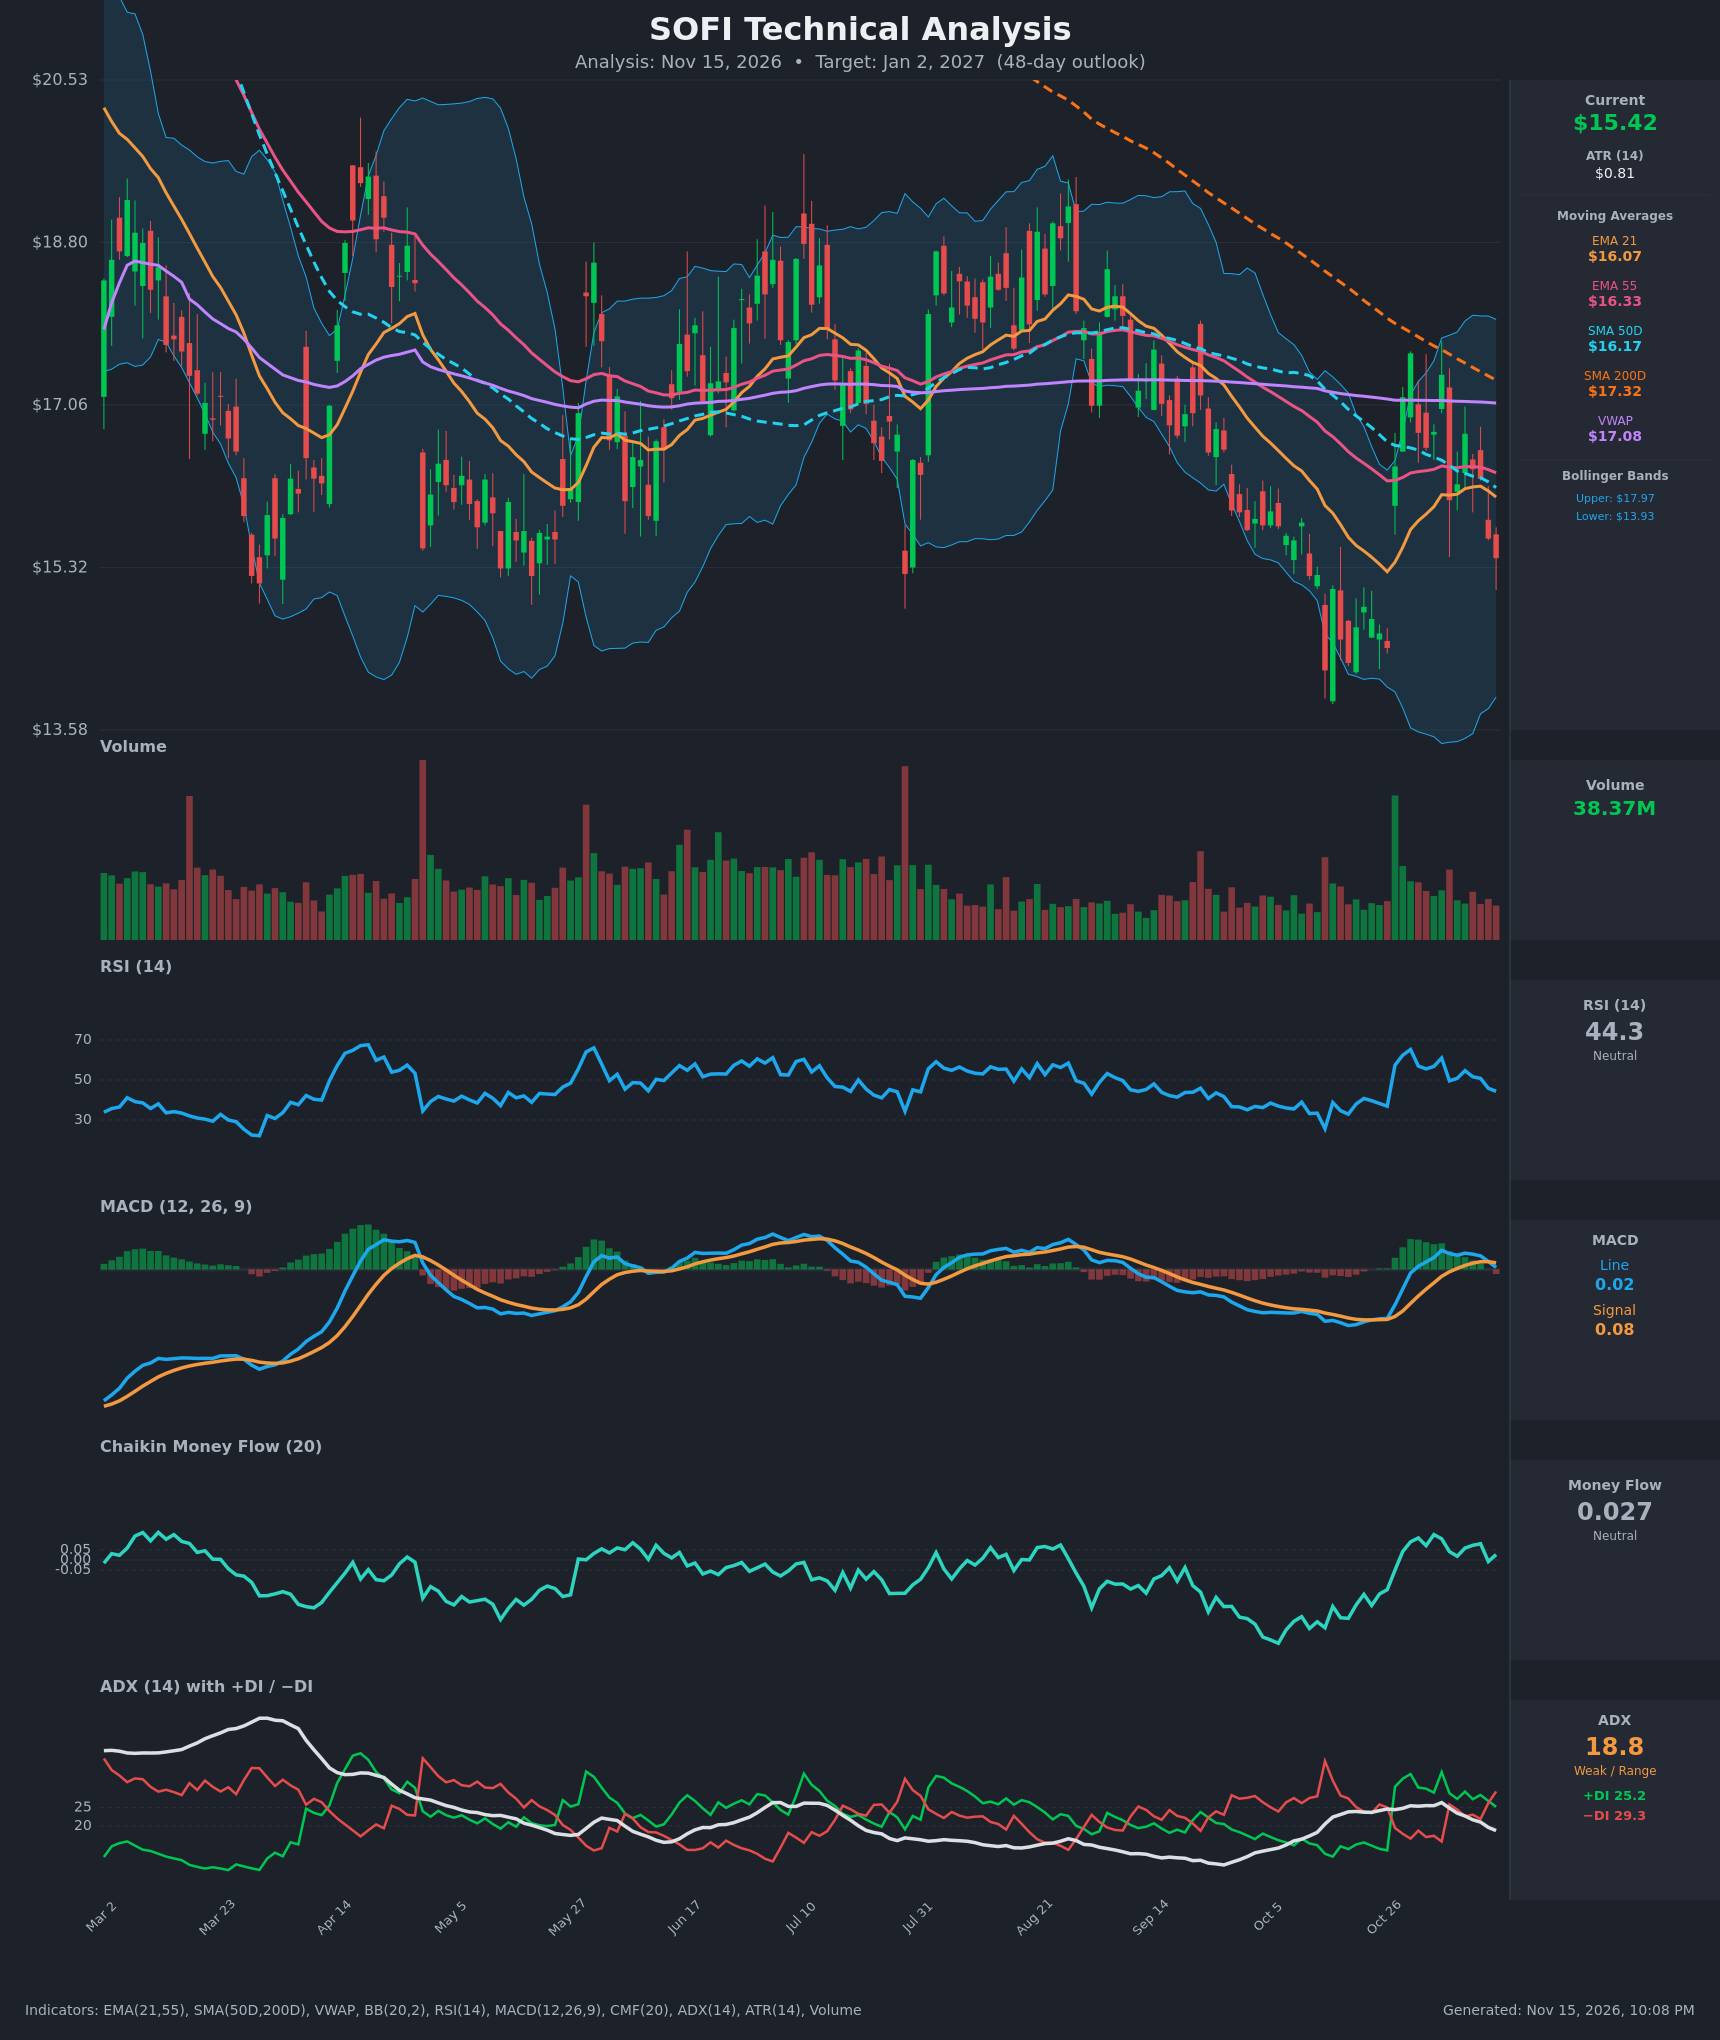
- RSI (14): 44.33, down from 65 on Oct 29 and below the 50 midline since Nov 12. Momentum is fading, but the reading is nowhere near oversold (30). [Bearish]
- 20 EMA: The EMA 21 is $16.07 and price at $15.42 is about 4% below it, so it now acts as resistance. EMA 21 is also below EMA 55 ($16.33), a bearish alignment. [Bearish]
- MACD: The line (0.024) crossed below the signal (0.080) on Nov 13, and the histogram has turned negative (about -0.055). The line is also about to cross the zero line, which would be a second bearish confirmation. [Bearish]
- Bollinger Bands (20): Upper band $17.97, lower band $13.93, midline about $15.95. Price sits in the lower half, below the midline, and the bands are fairly wide (about $4). Price is not at the lower band, so there is room to fall before an oversold touch. [Bearish]
- CMF (20): 0.027, inside the neutral band (±0.05). It has dropped from 0.126 on Nov 3 and briefly dipped negative on Nov 12, so buying pressure has evaporated without a clear shift to distribution. [Neutral]
- ADX (14): 18.8 and falling from 26, which signals a weak trend or range. −DI (29.3) is above +DI (25.2) after a bearish DI crossover on Nov 12. Sellers have the edge, but the trend lacks strength. [Weak Trend, Bearish lean]
- Volume: 38.37M, with recent down days on average volume and no capitulation spike. The only big recent surge was the Oct 27 rally bar. There is no clear accumulation, and the pullback shows modest selling. [Neutral to mildly Bearish]
DIVERGENCES & TRENDS
- Price is below every moving average: EMA 21 ($16.07), SMA 50 ($16.17), EMA 55 ($16.33), VWAP ($17.08) and SMA 200 ($17.32). A death cross is already in place, with SMA 50 below SMA 200 and the gap still wide, so the long-term trend is down.
- The bounce from the Oct 26 low ($14.46) peaked at $17.61 on Oct 29. Since then closes have made lower highs ($17.38, $16.75) and now a lower low ($15.42), a short-term bearish structure.
- MACD turned from a bullish cross (Oct 30) to a bearish cross (Nov 13), a failed momentum swing.
- There is no clear bullish or bearish divergence. RSI and price are falling together.
- The DI crossover (−DI above +DI) and falling ADX suggest a drift lower rather than a strong downtrend.
- The SMA 200D line is falling and well overhead, capping rallies.
CHART PATTERNS
- No pattern from the reference diagram is clean. The closest is a Bearish Flag/Pennant-style retracement, a relief rally from the October low that is now rolling over under the declining EMAs.
- The wider structure is a choppy range between roughly $13.9 and $17.6 with lower highs. That resembles a loose Descending Triangle only if the $13.9–14.5 zone gets retested and breaks.
- Targets:
- A retest of the Oct 26 low zone ($14.46) is the first objective.
- The $13.93 lower band and the October low is the next.
- A break below it would open the $13.00–13.30 area, a projected move of about $1.0–1.5.
- A Bullish Double Bottom is possible if price retests $14.0–14.5 and holds. That would need a close back above $16.2–16.4 to confirm.
POTENTIAL SCENARIOS
- Scenario 1: Bearish Drift to Retest October Lows — Price remains below the declining EMA 21/55 and SMA 50, MACD heads below zero, and −DI stays above +DI, so the stock slides toward the Oct 26 low zone. Trigger: close below $15.00 and then the $14.46 level. Target: $14.50–$14.60, with an extension to $13.90. Invalidation: daily close above $16.35 (EMA 55). (50% probability)
- Scenario 2: Neutral Range Chop — Weak ADX (below 20) keeps SOFI oscillating between roughly $14.4 and $16.2 as the 21 EMA caps rallies and the October low supports dips. Trigger: failed breakdown below $14.46 and failed push above $16.1. Target: $15.00–$15.60. Invalidation: close outside $14.30–$16.40. (25% probability)
- Scenario 3: Bullish Reclaim and Recovery — Buyers defend $14.5–15.0, CMF turns above +0.05, and price reclaims the EMA 21 and SMA 50 cluster, then heads toward the VWAP. Trigger: close above $16.40 on rising volume. Target: $17.00–$17.50 (VWAP and SMA 200). Invalidation: close below $14.46. (25% probability)
PRICE TARGETS
- Target Price: $14.60 (48-day, about 5.3% below current)
- Expected Range: $13.30 to $15.90 (width $2.60, about 16.9% of current price, in line with the 30–60 day guidance)
- Key Levels: Support at $14.46, Resistance at $16.07
OVERALL BIAS
OVERALL BIAS: BEARISH - Price is below all key moving averages with a death cross in place, MACD has crossed bearish, RSI is falling below 50, and −DI has taken control. The weak ADX limits conviction, so the most likely path is a drift toward the $14.4–14.6 October low zone.
This is educational analysis and not financial advice.