SOFI 62-day bearish forecast — Nov 15, 2026
- Bias: Bearish
- Timeframe: 62 days (made Nov 15, 2026, target date Jan 15, 2027)
- Price at analysis: $15.42
- Price target: $14.60
- Expected range: $12.60 – $17.20
- Result: Pending — graded after the close on Jan 15, 2027
Get a free AI analysis of SOFI today
Analysis
TECHNICAL INDICATORS
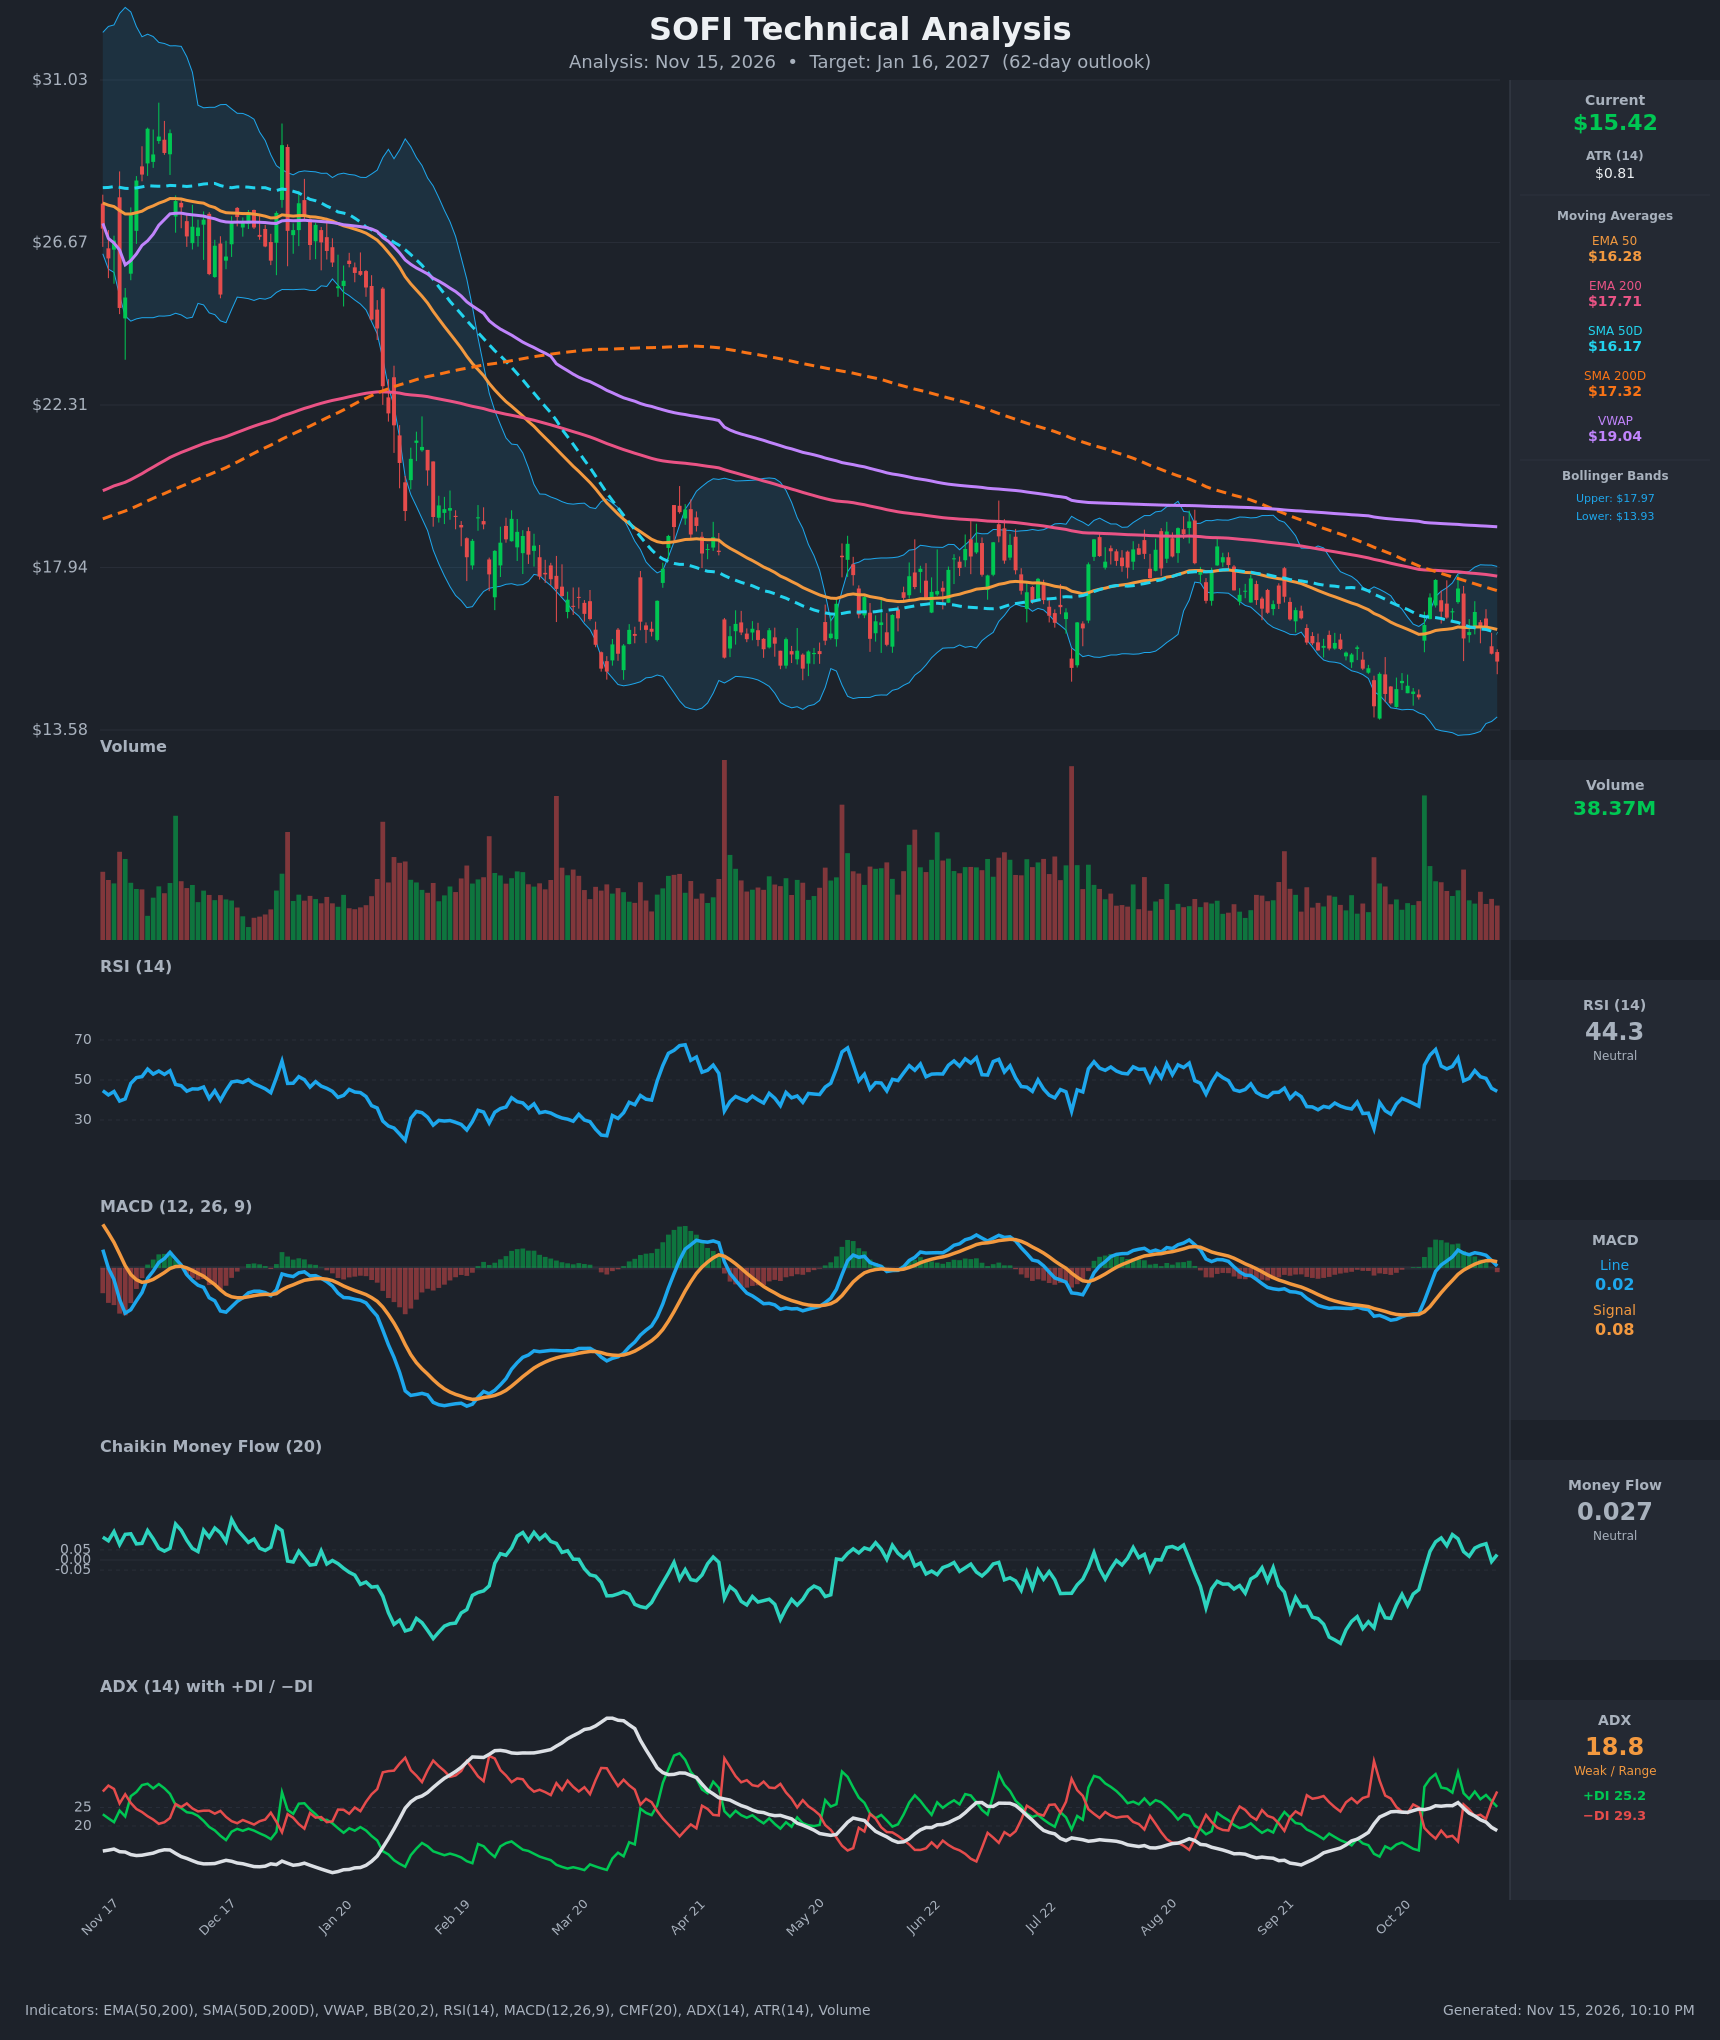
- RSI (14): 44.33, below the 50 midline and falling from about 61 on Nov 4. It is not oversold, so there is room to fall further before a bounce signal appears. [Bearish]
- 20 EMA: The chart shows EMA 50 ($16.28) and EMA 200 ($17.71) rather than a 20 EMA. Price at $15.42 is below both, and below SMA50D ($16.17) and SMA200D ($17.32). The 50 EMA is the nearest overhead resistance. VWAP at $19.04 is far above price. [Bearish]
- MACD: Line 0.024 crossed below Signal 0.080 on Nov 13, a fresh bearish crossover. The histogram has turned negative and the line is about to cross the zero line. [Bearish]
- Bollinger Bands (20): Upper $17.97, lower $13.94, midline about $15.95. Price sits just below the midline, in the lower half of the bands, with roughly $1.50 of room to the lower band. The bands are moderately wide, so volatility is not compressed. [Bearish]
- CMF (20): 0.027, inside the neutral zone (±0.05). It has faded from about 0.126 and dipped to -0.007 on Nov 12, so buying pressure is weakening. [Neutral]
- ADX (14): 18.8 and falling, which means a weak trend. −DI (29.3) has crossed back above +DI (25.2). Bears have the slight edge, but with ADX below 20 conviction is low. [Weak Trend, Bearish lean]
- Volume: 38.37M, near average. Recent down days came on stable volume with no capitulation spike. The big volume surge in late Oct marked the rally to $17.61, which has since faded. [Neutral to mildly bearish]
DIVERGENCES & TRENDS
- There is no clear divergence. RSI and MACD are making lower highs after the early-Nov peak, consistent with price rolling over from $17.61.
- The long-term trend is down. The 2026 decline from about $28 to about $15 shows the SMA50D and EMA50 below their 200-period counterparts. The SMA50D crossed below the SMA200D around Jan 20, which was the death cross. The SMAs and EMAs are all still falling and price sits beneath them.
- The MACD bearish crossover on Nov 13 and the −DI/+DI flip on Nov 12–13 are fresh bearish signals.
- Since March, price has based between roughly $14 and $19 in a broad range. It is now back near the lower half of that range, with the October low near $14 as the key support.
- The October rally to about $17.6 was rejected at the 200-period averages, which confirms that area as resistance.
CHART PATTERNS
- The broad range since March, with highs near $19 and lows near $14, resembles a large Descending Triangle / lower-high consolidation. Resistance keeps stepping down (the $19.5 highs in Aug, then $17.6 in Oct), while support sits near $14–$15. A break below $14 would target roughly $11–$12, the measured move from the pattern height.
- The Oct low near $14 followed by the rally and a retest from below forms a loose Double Bottom candidate. It is unconfirmed and would need a close above about $17.6 to activate, with a target near $20.
- The pattern evidence is mixed. The lower highs favor the bearish read over the bullish one.
POTENTIAL SCENARIOS
- Scenario 1: Bearish Retest of Range Lows — Price is below all major MAs, MACD has crossed down and −DI leads. A drift lower to the lower Bollinger Band and the October low area is the base case. Trigger: close below $15.00 with MACD going negative. Target: $13.60–$14.20. Invalidation: daily close above $16.30 (EMA 50). (50% probability)
- Scenario 2: Neutral Range Chop — ADX is below 20, so price oscillates between $14 and $17 without a decisive break. Trigger: holds $14.50 support and fails at $16.30. Target: $15.00–$16.00. Invalidation: close outside $14.00–$17.00. (30% probability)
- Scenario 3: Bullish Double-Bottom Recovery — Buyers defend the $14 area and push price back through the 50-day averages toward the 200-day cluster. Trigger: close above $16.30, then $17.70. Target: $17.70–$18.00. Invalidation: close below $14.00. (20% probability)
PRICE TARGETS
For a 62-day timeframe, the range width should be roughly 18–30% of current price. The expected range is $12.60 to $17.30, a width of $4.70, or about 30.5%. That is slightly wide but acceptable given SOFI's volatility (ATR $0.81).
- Target Price: $14.60 (62 days, Jan 16, 2027)
- Expected Range: $12.60 to $17.20
- Key Levels: Support at $14.00, Resistance at $16.28
OVERALL BIAS
OVERALL BIAS: BEARISH - Price is below every major moving average, MACD has made a bearish crossover, −DI is back above +DI, and RSI is rolling over, all within a long-term downtrend of lower highs. Weak ADX and neutral CMF limit conviction, so the expected move is a modest drift toward the $14 support zone.
This is educational analysis and not financial advice.