SOFI 83-day bearish forecast — Nov 15, 2026
- Bias: Bearish
- Timeframe: 83 days (made Nov 15, 2026, target date Feb 5, 2027)
- Price at analysis: $15.42
- Price target: $14.80
- Expected range: $12.60 – $17.40
- Result: Pending — graded after the close on Feb 5, 2027
Get a free AI analysis of SOFI today
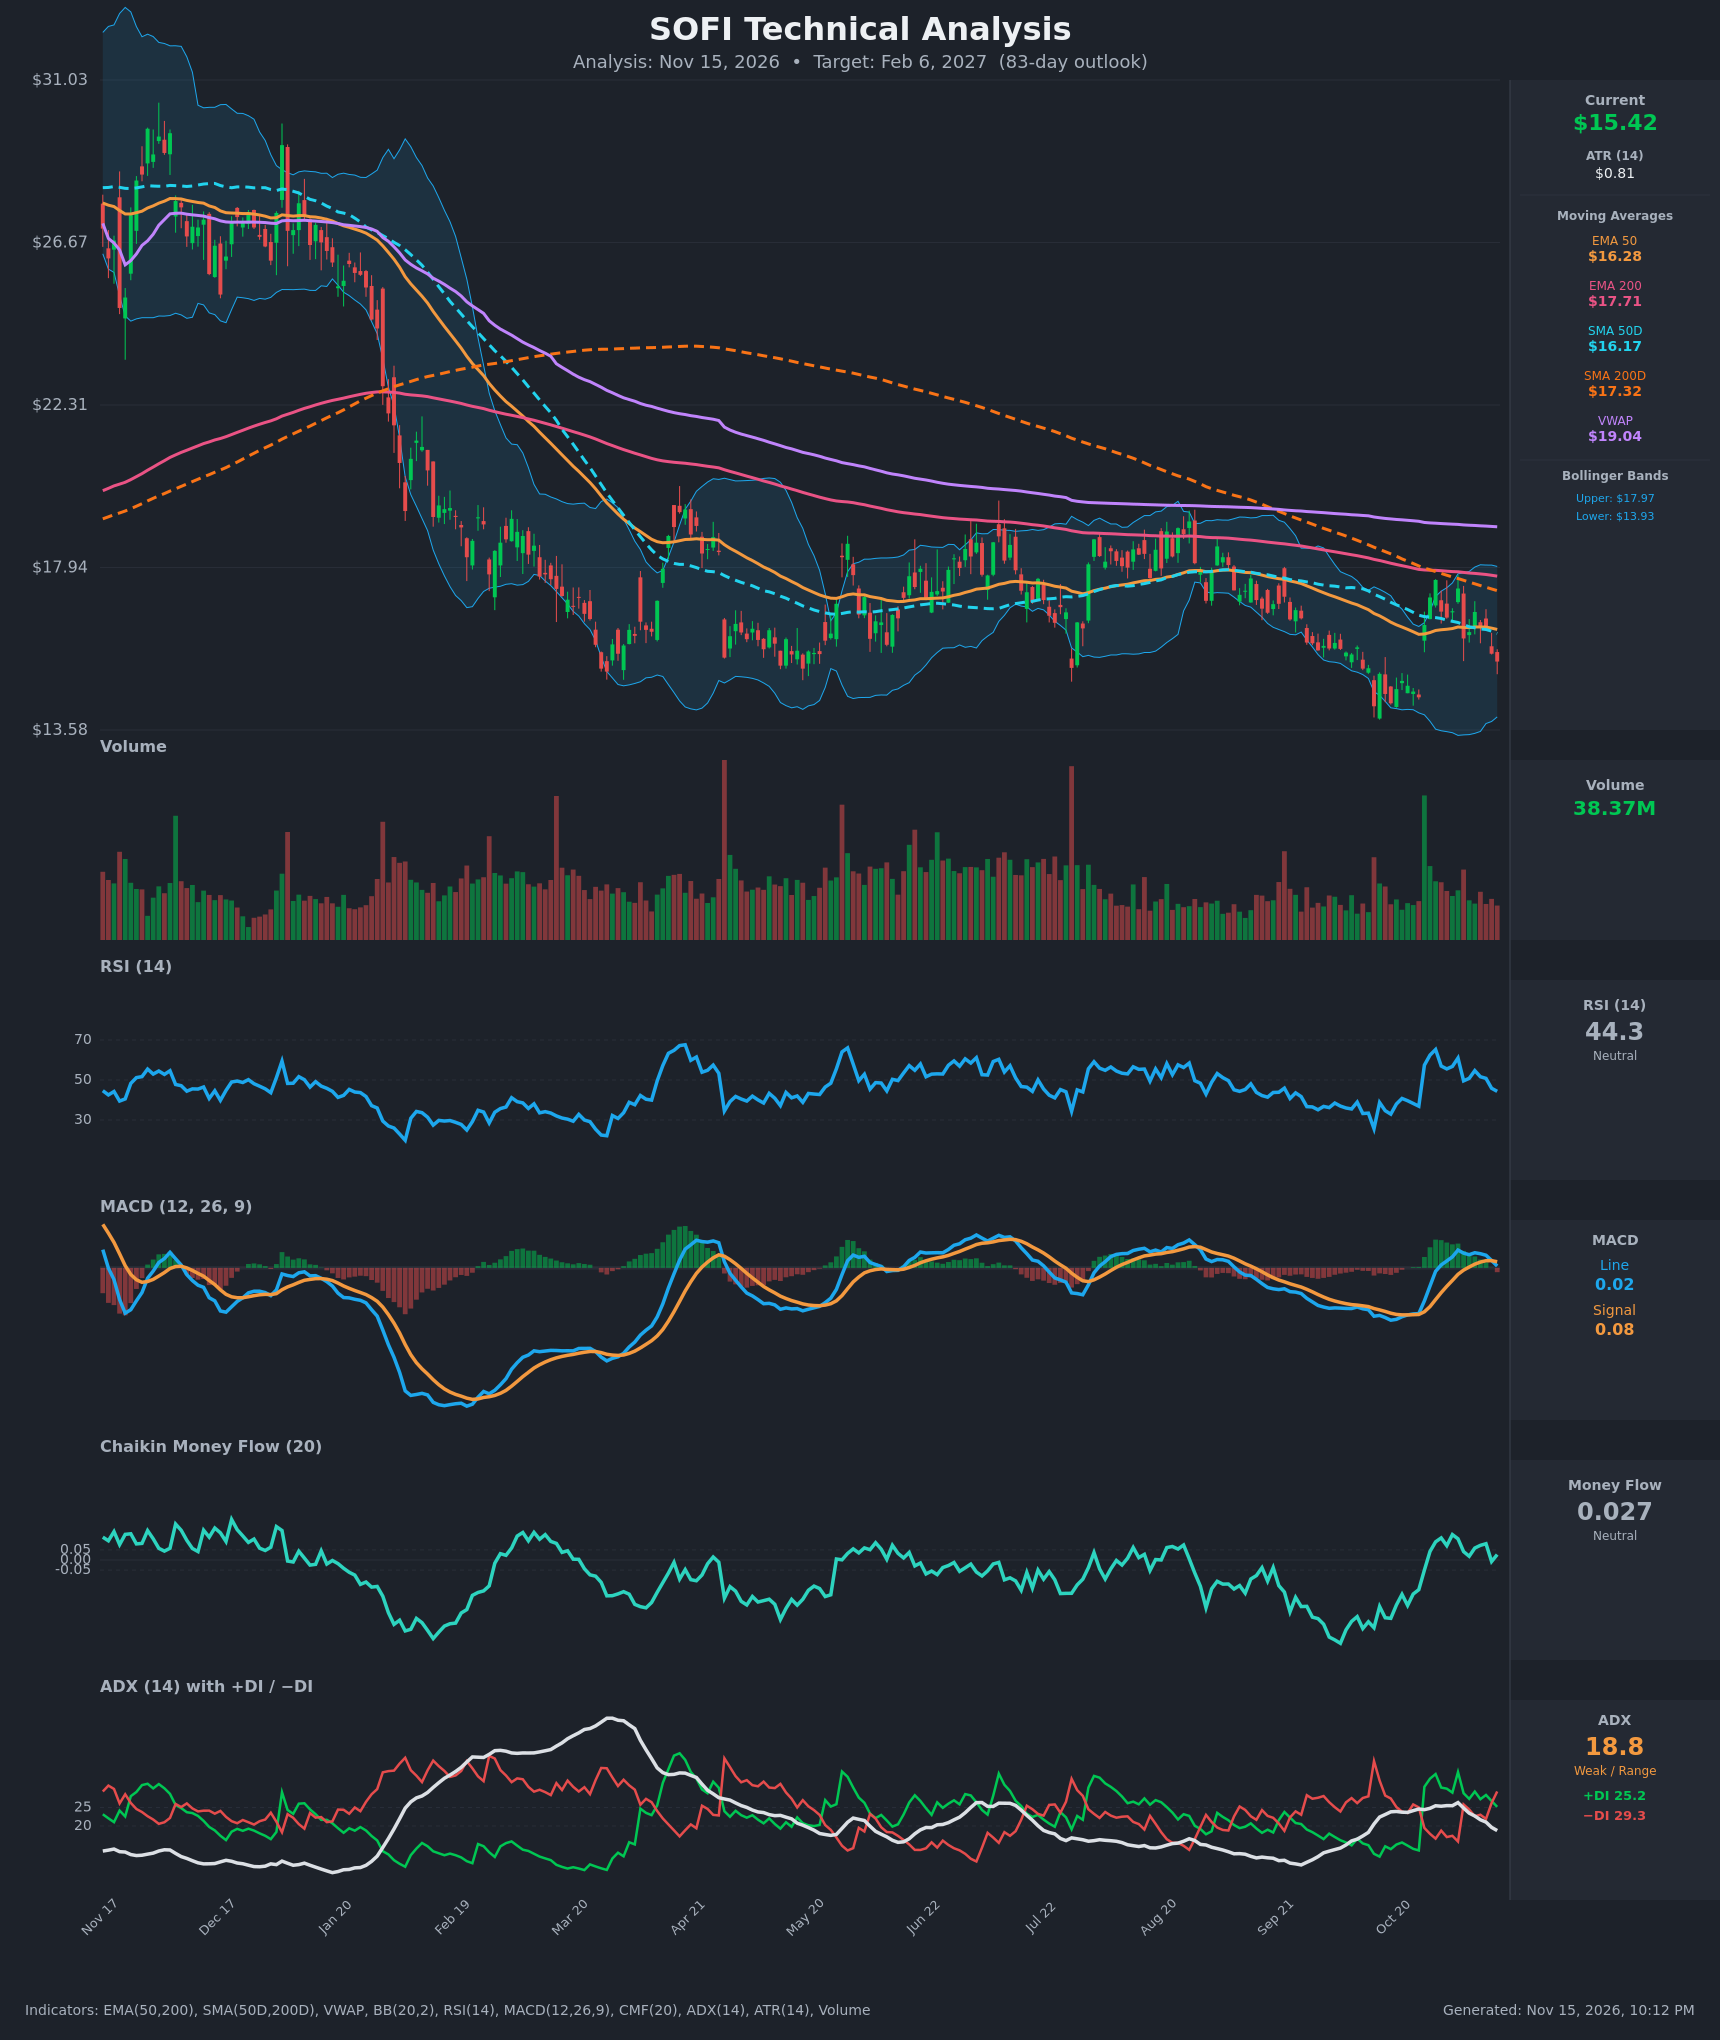
Analysis
TECHNICAL INDICATORS
- RSI (14): 44.33, down from 61 on Nov 4 and 54.7 on Nov 9. It sits below the 50 midline and is heading toward the 30-40 zone where earlier pullbacks found buyers. Momentum is fading but not oversold. [Bearish]
- 20 EMA: The 20 EMA isn't given directly. The EMA50 is $16.28 and price at $15.42 is below it, as it is below the SMA50D ($16.17). Price lost the 50-period averages on Nov 12-13, so they now act as overhead resistance. [Bearish]
- MACD: The line is 0.0242 against a signal of 0.0799. It crossed down on Nov 13 after a brief bullish cross on Oct 30 and Nov 6. The histogram has turned negative and the line is close to zero. [Bearish]
- Bollinger Bands (20): Upper is $17.97 and lower is $13.93, with a midline near $15.95. Price is below the midline, which is now resistance, with room down to the lower band (~$13.93). The October low near $14 is the key floor. [Bearish]
- CMF (20): 0.027 sits inside the neutral band after dipping to -0.007 on Nov 12. Buying pressure from the late-October bounce has faded, with no accumulation or distribution trend. [Neutral]
- ADX (14): 18.8 and falling, below 20, so the trend is weak. −DI (29.3) has crossed back above +DI (25.2), giving sellers a slight edge within a range-like market. [Weak Trend, Bearish lean]
- Volume: 38.37M, near average. The late-October spike (the largest recent bar) was a green bounce candle. Volume has since faded on the rejection at $17.4-17.6, so there is no strong conviction either way. [Neutral to slightly Bearish]
DIVERGENCES & TRENDS
- Price made lower lows into late October (~$14) while RSI held around 30-35. That was a mild bullish divergence, and it triggered a bounce to $17.6.
- The bounce failed at the declining EMA200 ($17.71) and SMA200D ($17.32). This is a classic rejection at long-term resistance.
- The SMA50D ($16.17) is below the SMA200D ($17.32). The death cross happened months ago, and the gap is narrowing only slowly.
- EMA50 is below EMA200, and both slope down. VWAP at $19.04 is well above price, which confirms a long-term downtrend.
- MACD just crossed bearishly and DI flipped back to bearish. RSI is rolling over from 61.
- ADX is falling, so the market is range-bound rather than trending.
CHART PATTERNS
- Since the May-Oct period, price has traded in a broad range between about $14 and $19.5, with lower highs. This looks like a Bearish Descending Triangle / Bearish Rising Wedge-type structure, though it is not a textbook match.
- The recent peak at $17.6 was lower than the prior rally highs (~$19.5). The flat support near $14-14.5 has been tested several times, a descending-triangle setup. A break below $14 would project a measured move of about $14 minus (19.5 - 14), roughly $9-10, though a 83-day move is unlikely to go that far.
- The more conservative read is a Bearish Pennant/Flag continuation inside the larger downtrend. The October bounce (the flagpole in reverse) was followed by a lower high and a rollover.
- The bullish alternative is a Bullish Double Bottom (the $14 lows in October and May-June). It needs a break above $17.7 to confirm, which is still far away.
POTENTIAL SCENARIOS
- Scenario 1: Bearish Retest of Range Lows — Price is rejected at the EMA50/SMA50D and the middle Bollinger band, then drifts back toward the $14 support, with a possible brief undercut. Trigger: close below $15.00 with MACD staying negative and −DI above +DI. Target: $13.80-$14.20. Invalidation: daily close above $16.70. (45% probability)
- Scenario 2: Neutral Range-Bound Chop — ADX stays below 20 and price oscillates between $14.30 and $17.00 around the $15.5-16 midpoint. Trigger: failure to break either the $14 floor or the $16.3 resistance. Target: $15.00-$16.00. Invalidation: close outside $14.00-$17.50. (25% probability)
- Scenario 3: Bullish Base Breakout — Holds $14, forms a double bottom, and reclaims the 50-period averages with improving CMF. Trigger: close above $16.30 and then $17.70. Target: $17.50-$18.50. Invalidation: close below $14.00. (30% probability)
PRICE TARGETS
- Target Price: $14.80 (83-day horizon, Feb 6, 2027)
- Expected Range: $12.60 to $17.40 (width $4.80, about 31% of the $15.42 current price, slightly above the 18-30% guide because SOFI's ATR of $0.81 is about 5% of price and daily volatility is high)
- Key Levels: Support at $14.00, Resistance at $16.30
OVERALL BIAS
OVERALL BIAS: BEARISH - Price sits below the EMA50 and SMA50D, and every long-term average above is declining and acting as resistance. MACD has crossed down, −DI is back above +DI, and the late-October bounce failed at the 200-period averages, leaving a retest of the $14 floor the most likely outcome.
This is educational analysis and not financial advice.