SOFI 34-day bearish forecast — Nov 15, 2026
- Bias: Bearish
- Timeframe: 34 days (made Nov 15, 2026, target date Dec 18, 2026)
- Price at analysis: $15.42
- Price target: $14.65
- Expected range: $13.60 – $16.30
- Result: Pending — graded after the close on Dec 18, 2026
Get a free AI analysis of SOFI today
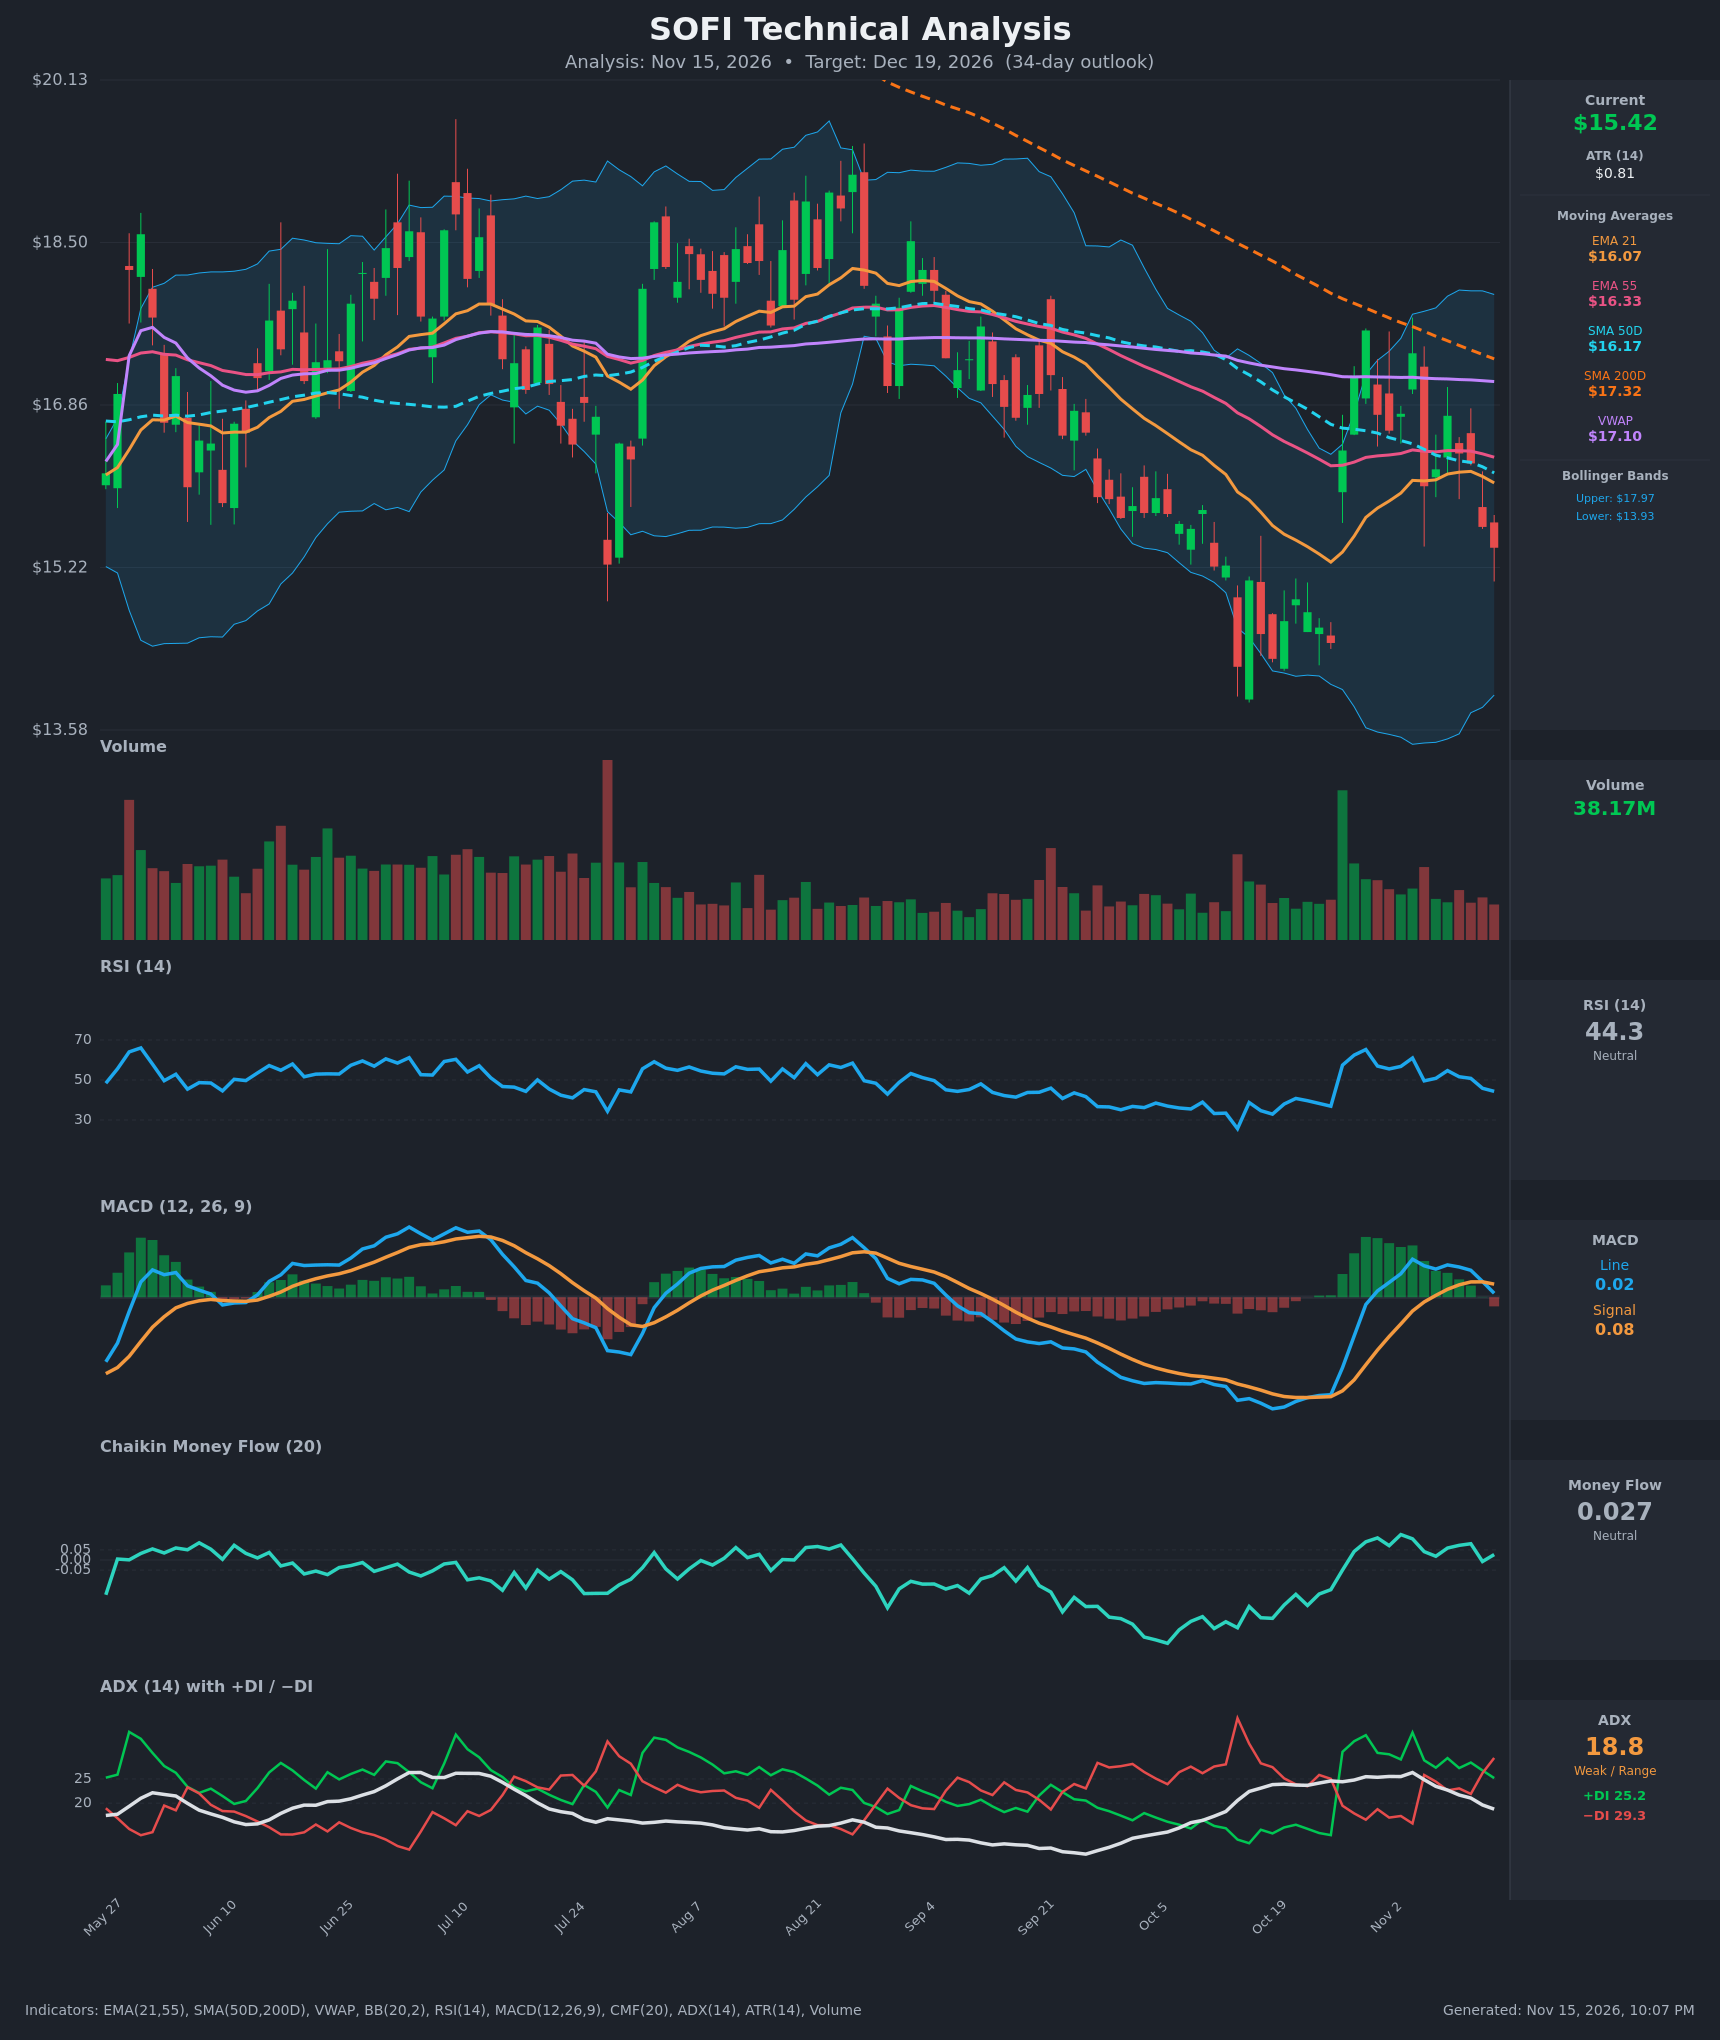
Analysis
TECHNICAL INDICATORS
- RSI (14): 44.33, down from 61 on Nov 4 and 55 on Nov 9, and now below the 50 midline. It is not oversold, so there is room to fall before a bounce becomes likely. [Bearish]
- 20 EMA: The 21 EMA is $16.07 and price at $15.42 is about 4% below it. The EMA21 has turned flat to down and is now overhead resistance. EMA21 ($16.07) is also below EMA55 ($16.33), a bearish stack. [Bearish]
- MACD: Line 0.024 is below signal 0.080, so a bearish crossover occurred on Nov 13. The histogram has flipped slightly negative, and the line is rolling over just above zero, which suggests the Oct 26 bounce is fading. [Bearish]
- Bollinger Bands (20): Upper $17.97, lower $13.93, so price sits in the lower half of the bands, below the midline (about $15.95). The bands are wide after the October volatility. Price has room to travel toward the lower band, and the midline now acts as resistance. [Bearish]
- CMF (20): 0.027, inside the neutral band (±0.05). It has faded from 0.126 on Nov 3, so buying pressure is weakening but there is no outright distribution yet. [Neutral]
- ADX (14): 18.8 and falling, which means a weak trend or range. The −DI (29.3) is above the +DI (25.2) after a bearish DI crossover on Nov 12, and the gap is widening. Trend strength is low, but direction is tilting down. [Weak Trend, Bearish Lean]
- Volume: 38.17M, in line with the recent average, with no capitulation spike. The last red candles came on moderate volume. The big volume spike on Oct 27 marked the rebound, and that rally has since been retraced. [Neutral to Mildly Bearish]
DIVERGENCES & TRENDS
- Moving averages: Price is below EMA21 ($16.07), EMA55 ($16.33), SMA50D ($16.17), VWAP ($17.10) and SMA200D ($17.32). The long-term trend is down.
- Death cross: SMA50D is already well below SMA200D, so the long-term bias remains bearish.
- Failed bounce: The Oct 26 low near $14.46 led to a rally to $17.61. Price then made a lower high at $17.38 and has now given back most of the gain. Momentum peaked at RSI 65 on Oct 29.
- Crossovers: The MACD bearish cross (Nov 13) and the −DI over +DI cross (Nov 12) both confirm the rollover.
- Divergence: No clear divergence. RSI and MACD are making lower highs in line with price.
- Descending resistance: The orange dashed trendline from the August high is still capping rallies.
CHART PATTERNS
- Bearish Double Top (reversal): The peaks at $17.61 (Oct 29) and $17.38 (Nov 4) are separated by a trough near $16.0. Price has now closed below the neckline of about $16.0.
- Measured move: Peak minus neckline is about $1.6, which projects to roughly $14.4 from the neckline break.
- Support to watch: This target lines up with the Oct 26 close near $14.46, and the lower Bollinger Band sits at $13.93.
- Overlay: The descending trendline from August reinforces the bearish structure. A rebound into $16.0–16.3 would be a retest of the broken neckline, which is a typical sell setup.
- Caveat: ADX is weak, so a range between $14.4 and $16.3 is possible rather than a clean breakdown.
POTENTIAL SCENARIOS
- Scenario 1: Bearish Double Top Breakdown — Price continues lower after the neckline break and bearish MACD/DI crosses, with sellers defending the EMA21/EMA55 zone. Trigger: a daily close below $15.00 or a failed retest of $16.0. Target: $14.40–$14.60, with an extension to $13.93 (lower BB). Invalidation: a daily close above $16.35 (EMA55). (55% probability)
- Scenario 2: Neutral Range Chop — Price oscillates between the Oct low area and the EMA cluster as ADX stays under 20. Trigger: holds above $14.50 with RSI stabilizing near 40–50. Target: $14.80–$16.00. Invalidation: a close below $14.40 or above $16.40. (25% probability)
- Scenario 3: Bullish Reclaim — Price bounces off oversold conditions and recovers the 21/55 EMA zone and the SMA50D. Trigger: a close above $16.35 with MACD re-crossing and CMF above 0.05. Target: $17.10 (VWAP), then $17.60. Invalidation: rejection at $16.3 or a close back below $15.2. (20% probability)
PRICE TARGETS
- Target Price: $14.65 (34-day)
- Expected Range: $13.60 to $16.30. Width is $2.70, about 17.5% of the current price, which fits the 30-60 day guidance of 12-18%.
- Key Levels: Support at $14.46, Resistance at $16.07
OVERALL BIAS
OVERALL BIAS: BEARISH - Price is below all key moving averages after a bearish MACD cross and a −DI over +DI cross, with RSI rolling over below 50. The double top neckline break projects to about $14.4–$14.6, though weak ADX caps conviction.
This is educational analysis and not financial advice.