SOFI 20-day bearish forecast — Nov 15, 2026
- Bias: Bearish
- Timeframe: 20 days (made Nov 15, 2026, target date Dec 4, 2026)
- Price at analysis: $15.42
- Price target: $14.95
- Expected range: $14.30 – $15.90
- Result: Pending — graded after the close on Dec 4, 2026
Get a free AI analysis of SOFI today
Analysis
TECHNICAL INDICATORS
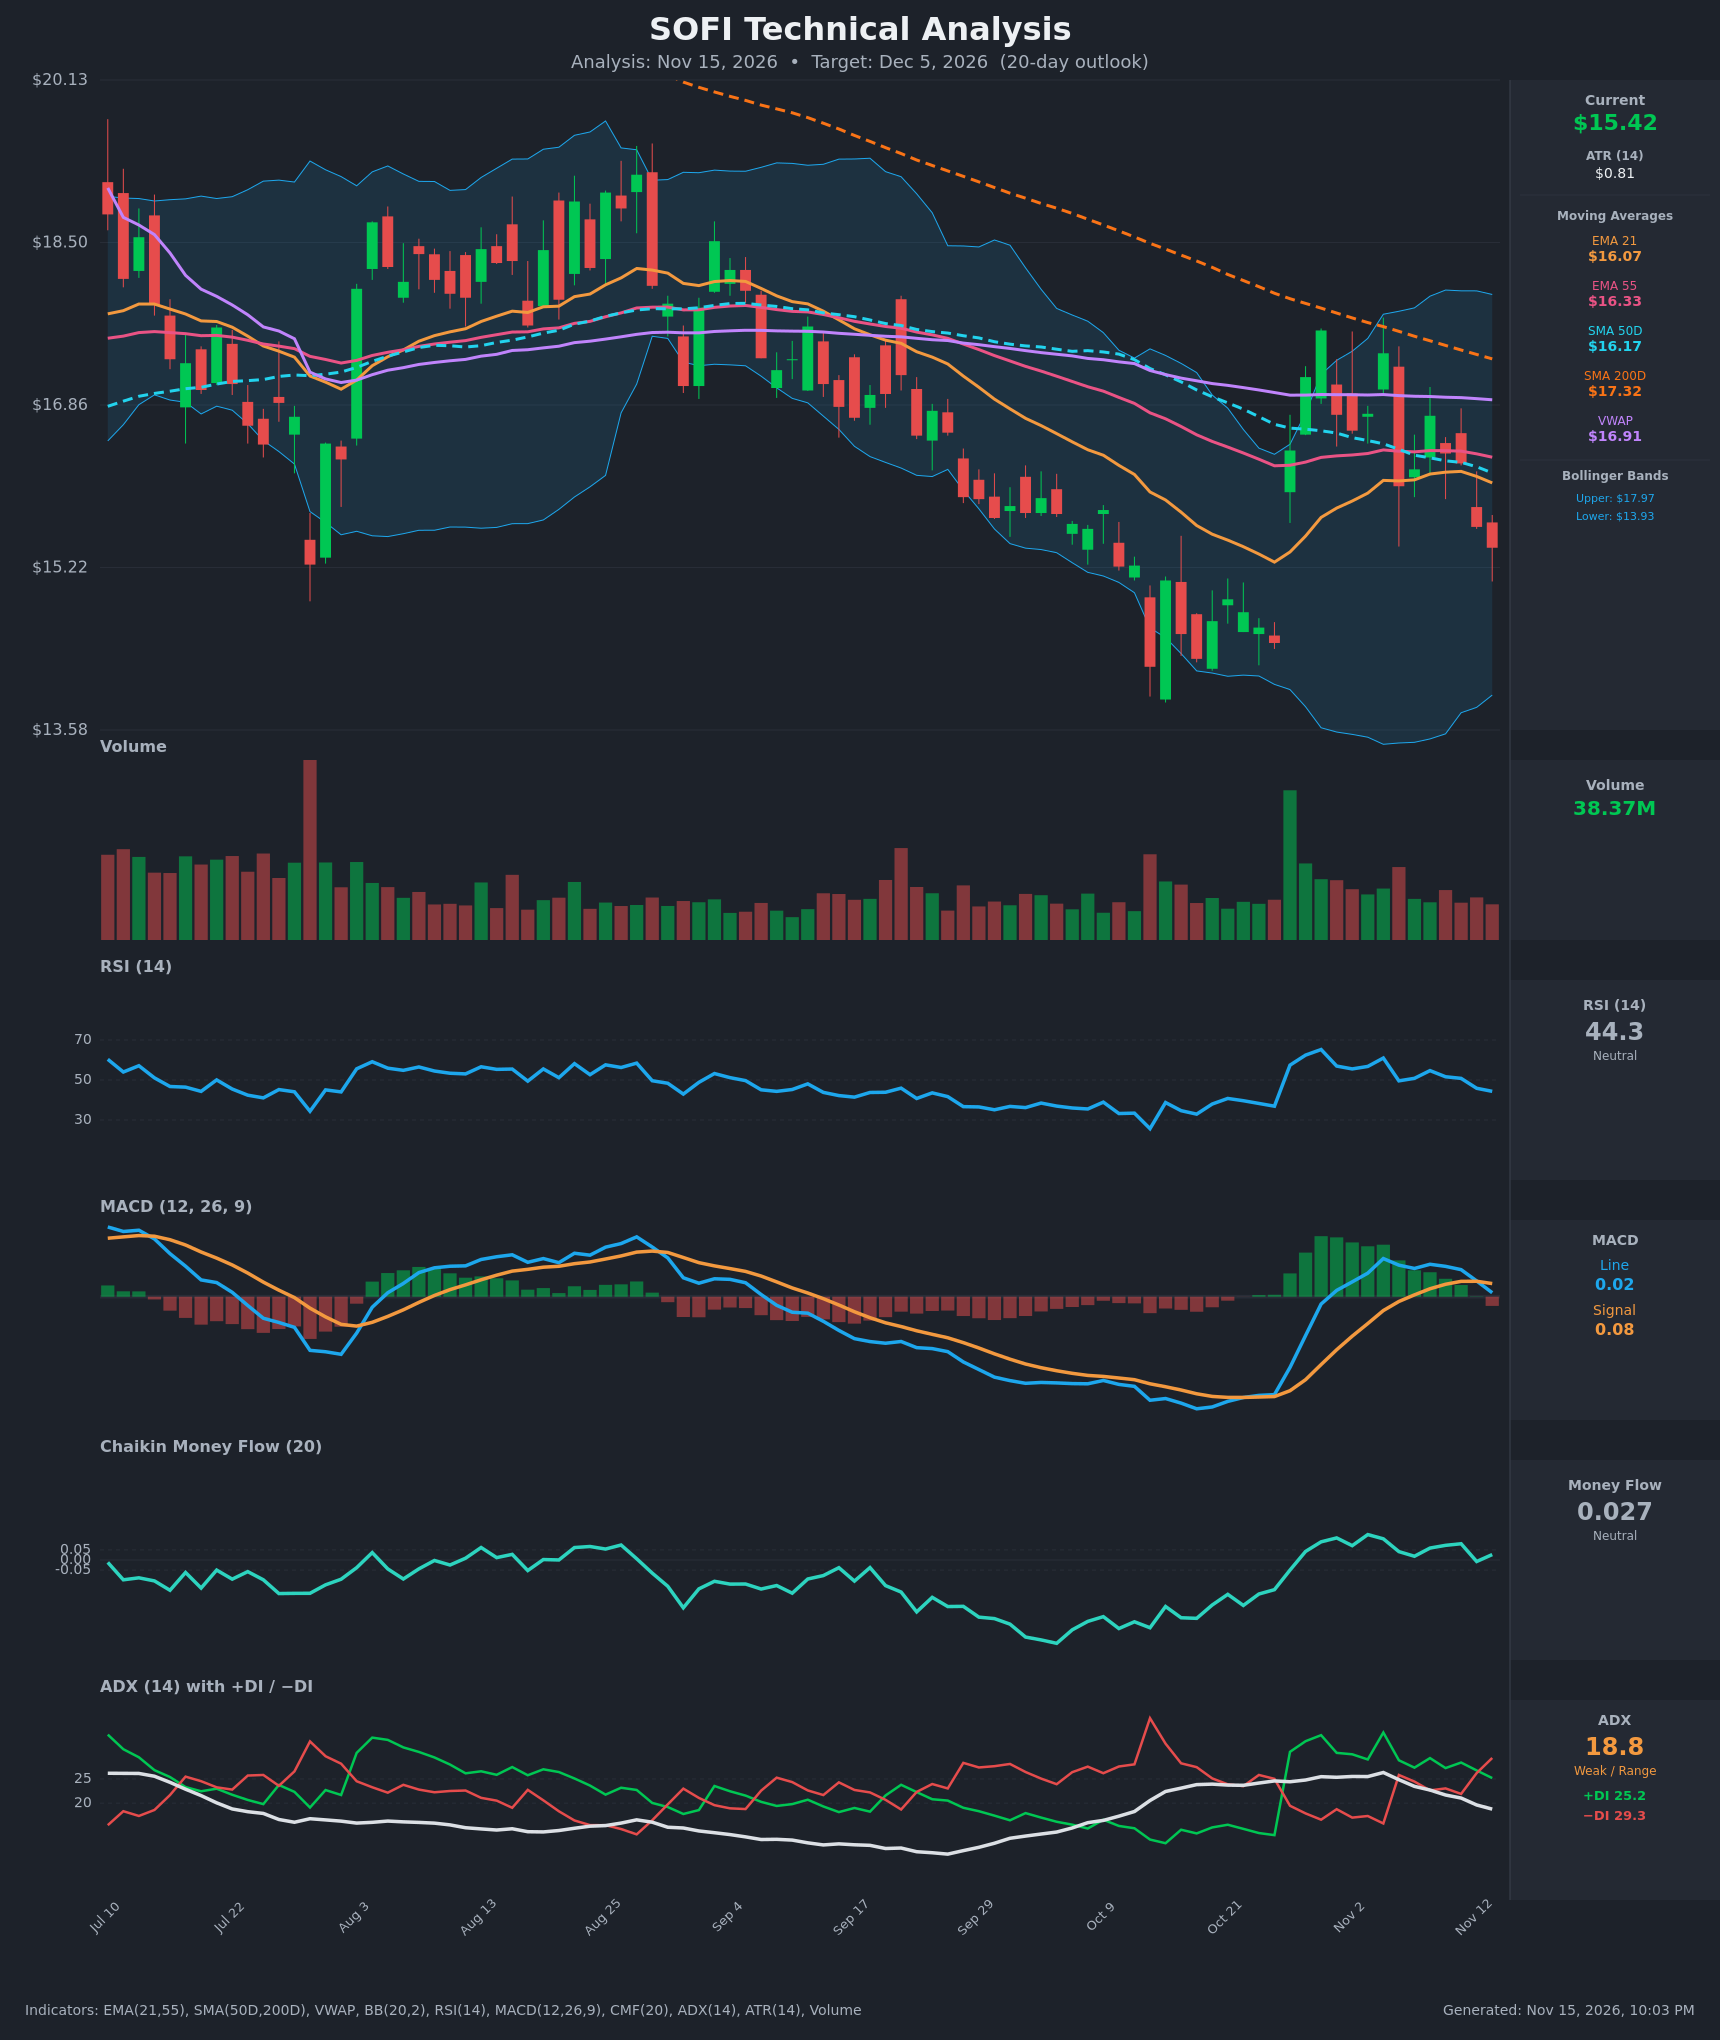
- RSI (14): 44.33, down from 65 on Oct 29 and 61 on Nov 4. It has slipped below the 50 midline and is falling, with room to drop before reaching oversold at 30. [Bearish]
- 20 EMA: The 21 EMA is $16.07 and price at $15.42 is about 4% below it, so it now acts as resistance. Price lost it on Nov 12, and the EMA21 ($16.07) is also below EMA55 ($16.33). [Bearish]
- MACD: The line (0.024) crossed below the signal (0.080) on Nov 13. The histogram has flipped negative and the line is rolling over toward zero. The earlier bullish crossover has not followed through. [Bearish]
- Bollinger Bands (20): The bands run from $13.93 to $17.97, so the midline is about $15.95. Price sits in the lower half, below the midline, with the lower band about $1.50 away. The bands are wide, which reflects the Oct volatility spike rather than a squeeze. [Bearish]
- CMF (20): 0.027 sits inside the ±0.05 neutral band. It has faded from 0.126 on Nov 3 and dipped negative (-0.007) on Nov 12, so buying pressure is weakening but there is no clear distribution. [Neutral]
- ADX (14): 18.8 and falling, so the trend is weak and range-like. −DI (29.3) is above +DI (25.2) after crossing on Nov 5 and again on Nov 12, giving bears a mild edge. [Weak Trend, Bearish lean]
- Volume: 38.37M on the latest bar, which is average. Recent red candles have come on similar or slightly heavier volume than the green ones. The big accumulation spike was the Oct 27 reversal day, and there has been no follow-through buying since. [Neutral to mildly Bearish]
DIVERGENCES & TRENDS
- Price is below EMA21, EMA55, SMA50D ($16.17), SMA200D ($17.32) and VWAP ($16.91). That puts it below every major average.
- The SMA200D has been falling for weeks and sits well above price. The 50D has been below the 200D since before this window (a death-cross configuration), so the long-term trend is still down.
- There is no strong divergence. RSI and MACD are both weakening in line with price. The Oct low of about $13.9 produced the extreme reading, and the bounce to $17.61 formed a lower high compared with the late-summer highs.
- The recent bounce peaked at $17.61 on Oct 29 and has since made lower highs ($17.38, then $16.75). That is a fading rally.
- The bearish MACD cross on Nov 13 and the −DI > +DI cross on Nov 12 are the newest signals. ADX below 20 limits conviction.
- The orange dashed line on the chart (a descending trendline) still caps rallies in the $17.4–17.8 area.
CHART PATTERNS
- There is no clean textbook pattern. The structure loosely resembles a Bearish Flag/Descending structure: a sharp rally off the Oct low, followed by a drift of lower highs and lower lows. The bounce is failing under the falling EMA cluster at $16.07–$16.33.
- A break below the Oct 26 close ($14.46) would confirm a lower low. The measured move from the failed bounce points toward the $13.9–14.0 Oct low, which is also the lower Bollinger Band.
- The alternative reading is a Bullish Double Bottom (Oct low near $13.9, then a retest). It would need a close above $17.0–$17.6 to activate. It is not confirmed and would require reclaiming all the moving averages.
POTENTIAL SCENARIOS
- Scenario 1: Bearish Fade Toward the Oct Lows — The bounce has failed under the EMA21/55 cluster, MACD has crossed down, and −DI leads. Price drifts lower toward the prior reaction low. Trigger: a daily close below $14.95 and then $14.46. Target: $14.00–$14.95, with the lower Bollinger Band near $13.93 as an extension. Invalidation: a daily close above $16.35 (EMA55). (50% probability)
- Scenario 2: Neutral Range Chop — ADX is weak, so price oscillates between support near $14.50 and resistance near $16.10–$16.35 without a decisive break. Trigger: failure to close beyond either boundary. Target: $15.00–$15.90. Invalidation: a close below $14.46 or above $16.35. (28% probability)
- Scenario 3: Bullish Reclaim and Squeeze — Price recovers the EMA21 and SMA50D and pushes toward VWAP and the SMA200D. Trigger: a close above $16.35 with CMF above +0.05 and a MACD re-cross. Target: $16.90–$17.30. Invalidation: a close back below $15.40. (22% probability)
PRICE TARGETS
- Target Price: $14.95 (20-day, about 3% below current)
- Expected Range: $14.30 to $15.90 (width $1.60, about 10.4% of current price, consistent with the 14–21 day guidance)
- Key Levels: Support at $14.46, Resistance at $16.07
OVERALL BIAS
OVERALL BIAS: BEARISH - Price is below every major moving average and VWAP. MACD has crossed bearishly, RSI has fallen below 50, and −DI leads +DI after a failed bounce. ADX is weak and CMF neutral, so conviction is modest and the downside is likely a grind rather than a collapse.
This is educational analysis and not financial advice.