SOFI 4-day bullish forecast — Nov 1, 2026
- Bias: Bullish
- Timeframe: 4 days (made Nov 1, 2026, target date Nov 4, 2026)
- Price at analysis: $16.75
- Price target: $16.92
- Expected range: $16.42 – $17.12
- Result: Correct (+3.7%) — closed at $17.38 on Nov 4, 2026; quality score 79/100
Get a free AI analysis of SOFI today
Analysis
TECHNICAL INDICATORS
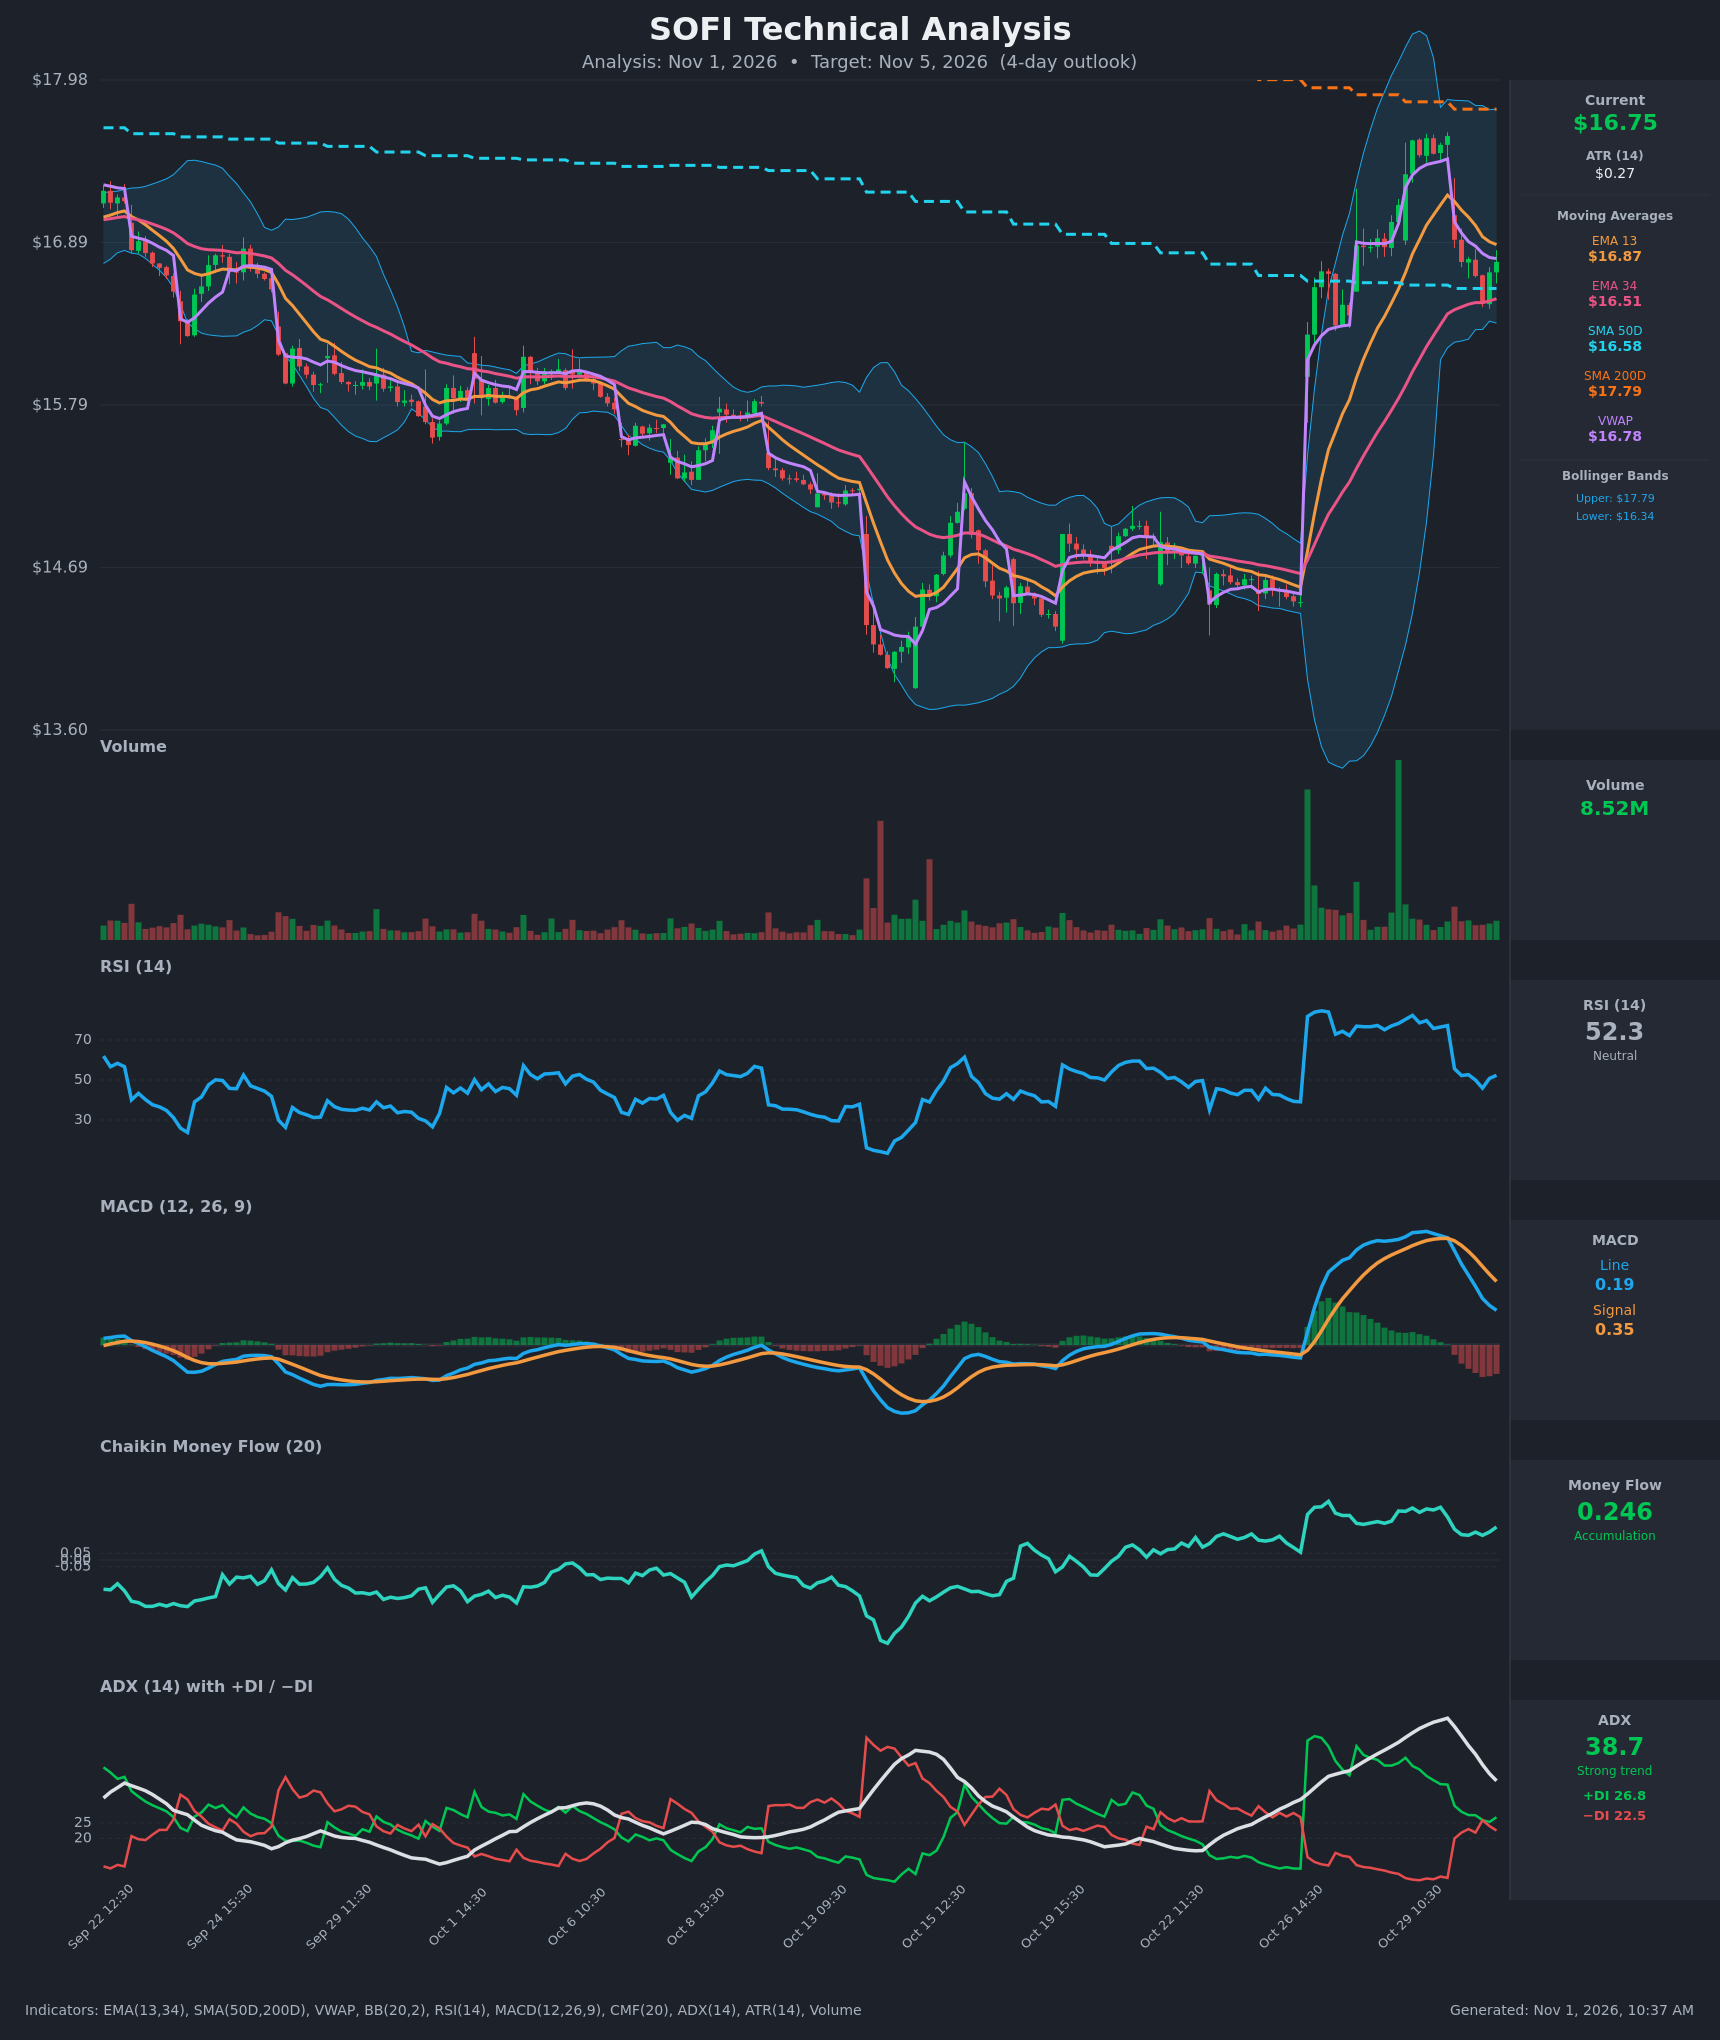
- RSI (14): 52.34, back at neutral after a deeply overbought run (82.3 on Oct 29). It has stabilized between 46 and 53 over the last few bars, so the momentum reset looks mostly done. [Neutral]
- 20 EMA: Only EMA 13 ($16.87) and EMA 34 ($16.51) are supplied, so I use them as the short-term proxies. Price ($16.755) is below EMA 13, which is now resistance, and above EMA 34, which is support. EMA 13 is still above EMA 34 but the gap has narrowed from about $0.74 to $0.36, and EMA 13 is rolling over. [Neutral]
- MACD: Line 0.191 is below Signal 0.350, so the bearish crossover happened on Oct 30 morning. The histogram is negative (about -0.16) and has widened for several bars, though the line is decelerating toward zero. [Bearish]
- Bollinger Bands (20): Upper $17.785, lower $16.343, midline about $17.06. Price is in the lower half of the bands, about 29% of the way from the lower band to the upper. The bands are very wide after the gap-up. The lower band at $16.34 sits just under the Oct 30 low of $16.48. [Neutral]
- CMF (20): 0.246, well above +0.05. It has stayed positive throughout the pullback and has even ticked up in the last two bars, so buyers are not distributing on this dip. [Accumulation]
- ADX (14): 38.7 and falling from a 59 peak, so the trend is strong but fading. +DI (26.8) is above −DI (22.5), but the spread has narrowed sharply (it was 37 vs 7). −DI briefly equaled +DI at 25.9 on Oct 30 13:30 and has not taken over. [Strong but Weakening Trend, Bullish lean]
- Volume: 8.52M, in line with typical activity. The pullback came on modest volume compared with the huge gap-up bars (Oct 27 and Oct 29), so there is no heavy distribution selling. [Neutral-to-Mildly Bullish]
Moving average context:
- Price is below SMA 200D ($17.79), so the long-term trend is still down and this is overhead resistance.
- Price is above SMA 50D ($16.58), which is short-term support.
- VWAP is $16.78, so price sits essentially on it.
- SMA 50D is below SMA 200D, so no golden cross has occurred.
DIVERGENCES & TRENDS
- There is no classic divergence. RSI and price both retraced together from the Oct 29 highs.
- MACD is in a bearish crossover and decelerating. The line has dropped from 0.627 to 0.191, but the Oct 30 15:30 decline (0.218 to 0.191) is much smaller than earlier steps. A histogram trough could form within 1–2 sessions.
- CMF stays strongly positive while price and MACD fall. This is a mild bullish divergence, suggesting the pullback is corrective rather than distributive.
- ADX is falling from an extreme high, which signals trend exhaustion and a transition into consolidation rather than a new directional leg.
- Price made a higher low relative to the gap base ($16.3), and the $16.48 low held at the EMA 34 / SMA 50D zone (about $16.5–16.6).
- Price is oscillating around VWAP ($16.78).
- The EMA 13 / EMA 34 gap is compressing, which points to a test of EMA 34 unless buyers defend.
CHART PATTERNS
- Bullish Flag / Pullback after a gap-up (Continuation): The impulse run from about $14.3 to $17.6 was followed by a downward-sloping pullback to $16.5–16.8. This resembles the Bullish Flag Pattern in the reference. A breakout above the flag's upper trendline (about $17.00) would project a measured move toward $17.5–17.8, which also coincides with the upper Bollinger Band and the SMA 200D.
- Failure risk: The sharp drop on Oct 30 retraced most of the Oct 29 gains. A close below $16.45 (the EMA 34, SMA 50D and Oct 30 low cluster) would invalidate the flag and open the gap-fill zone toward the lower band, about $16.30 and then $15.9.
- Overall: The structure is a pullback within a bounce inside a larger downtrend (price below the SMA 200D). Targets over 4 days are modest.
POTENTIAL SCENARIOS
- Scenario 1: Bullish Flag Hold and Rebound — Price holds the EMA 34 / SMA 50D support and rebounds as the MACD histogram troughs. CMF accumulation supports the bounce. Trigger: reclaim of EMA 13 ($16.87) and VWAP, then a push through $17.00. Target: $16.95–17.20. Invalidation: close below $16.45. (45% probability)
- Scenario 2: Bearish Support Break and Gap Fill — Falling MACD and the loss of EMA 13 let sellers press down to the support cluster. Trigger: hourly close below $16.45 with rising volume. Target: $16.30 (lower Bollinger Band), then $16.00. Invalidation: reclaim of $16.90. (35% probability)
- Scenario 3: Neutral Chop Under EMA 13 — Price consolidates between $16.50 and $16.90 as ADX decays. Trigger: failed breaks of both $16.45 and $16.87. Target: $16.65–16.85. Invalidation: a decisive close outside the $16.45–$17.00 band. (20% probability)
PRICE TARGETS
- Target Price: $16.92 (4 days, Nov 5)
- Expected Range: $16.42 to $17.12 (width $0.70, about 4.2% of current price, consistent with a 4-day timeframe)
- Key Levels: Support at $16.48, Resistance at $17.00 (first hurdle: EMA 13 at $16.87)
OVERALL BIAS
OVERALL BIAS: BULLISH - The pullback looks corrective: CMF shows strong accumulation, +DI stays above −DI, the RSI overbought condition has reset to neutral, and price is holding above the EMA 34 / SMA 50D support cluster near $16.5. The bearish MACD crossover and the overhead SMA 200D limit conviction, so the upside is modest.
This is educational analysis and not financial advice.