SOXS 6-day bearish forecast — Nov 1, 2026
- Bias: Bearish
- Timeframe: 6 days (made Nov 1, 2026, target date Nov 6, 2026)
- Price at analysis: $52.05
- Price target: $50.20
- Expected range: $48.40 – $52.40
- Result: Incorrect (+36.3%) — closed at $70.95 on Nov 6, 2026; quality score 0/100
Get a free AI analysis of SOXS today
Analysis
TECHNICAL INDICATORS
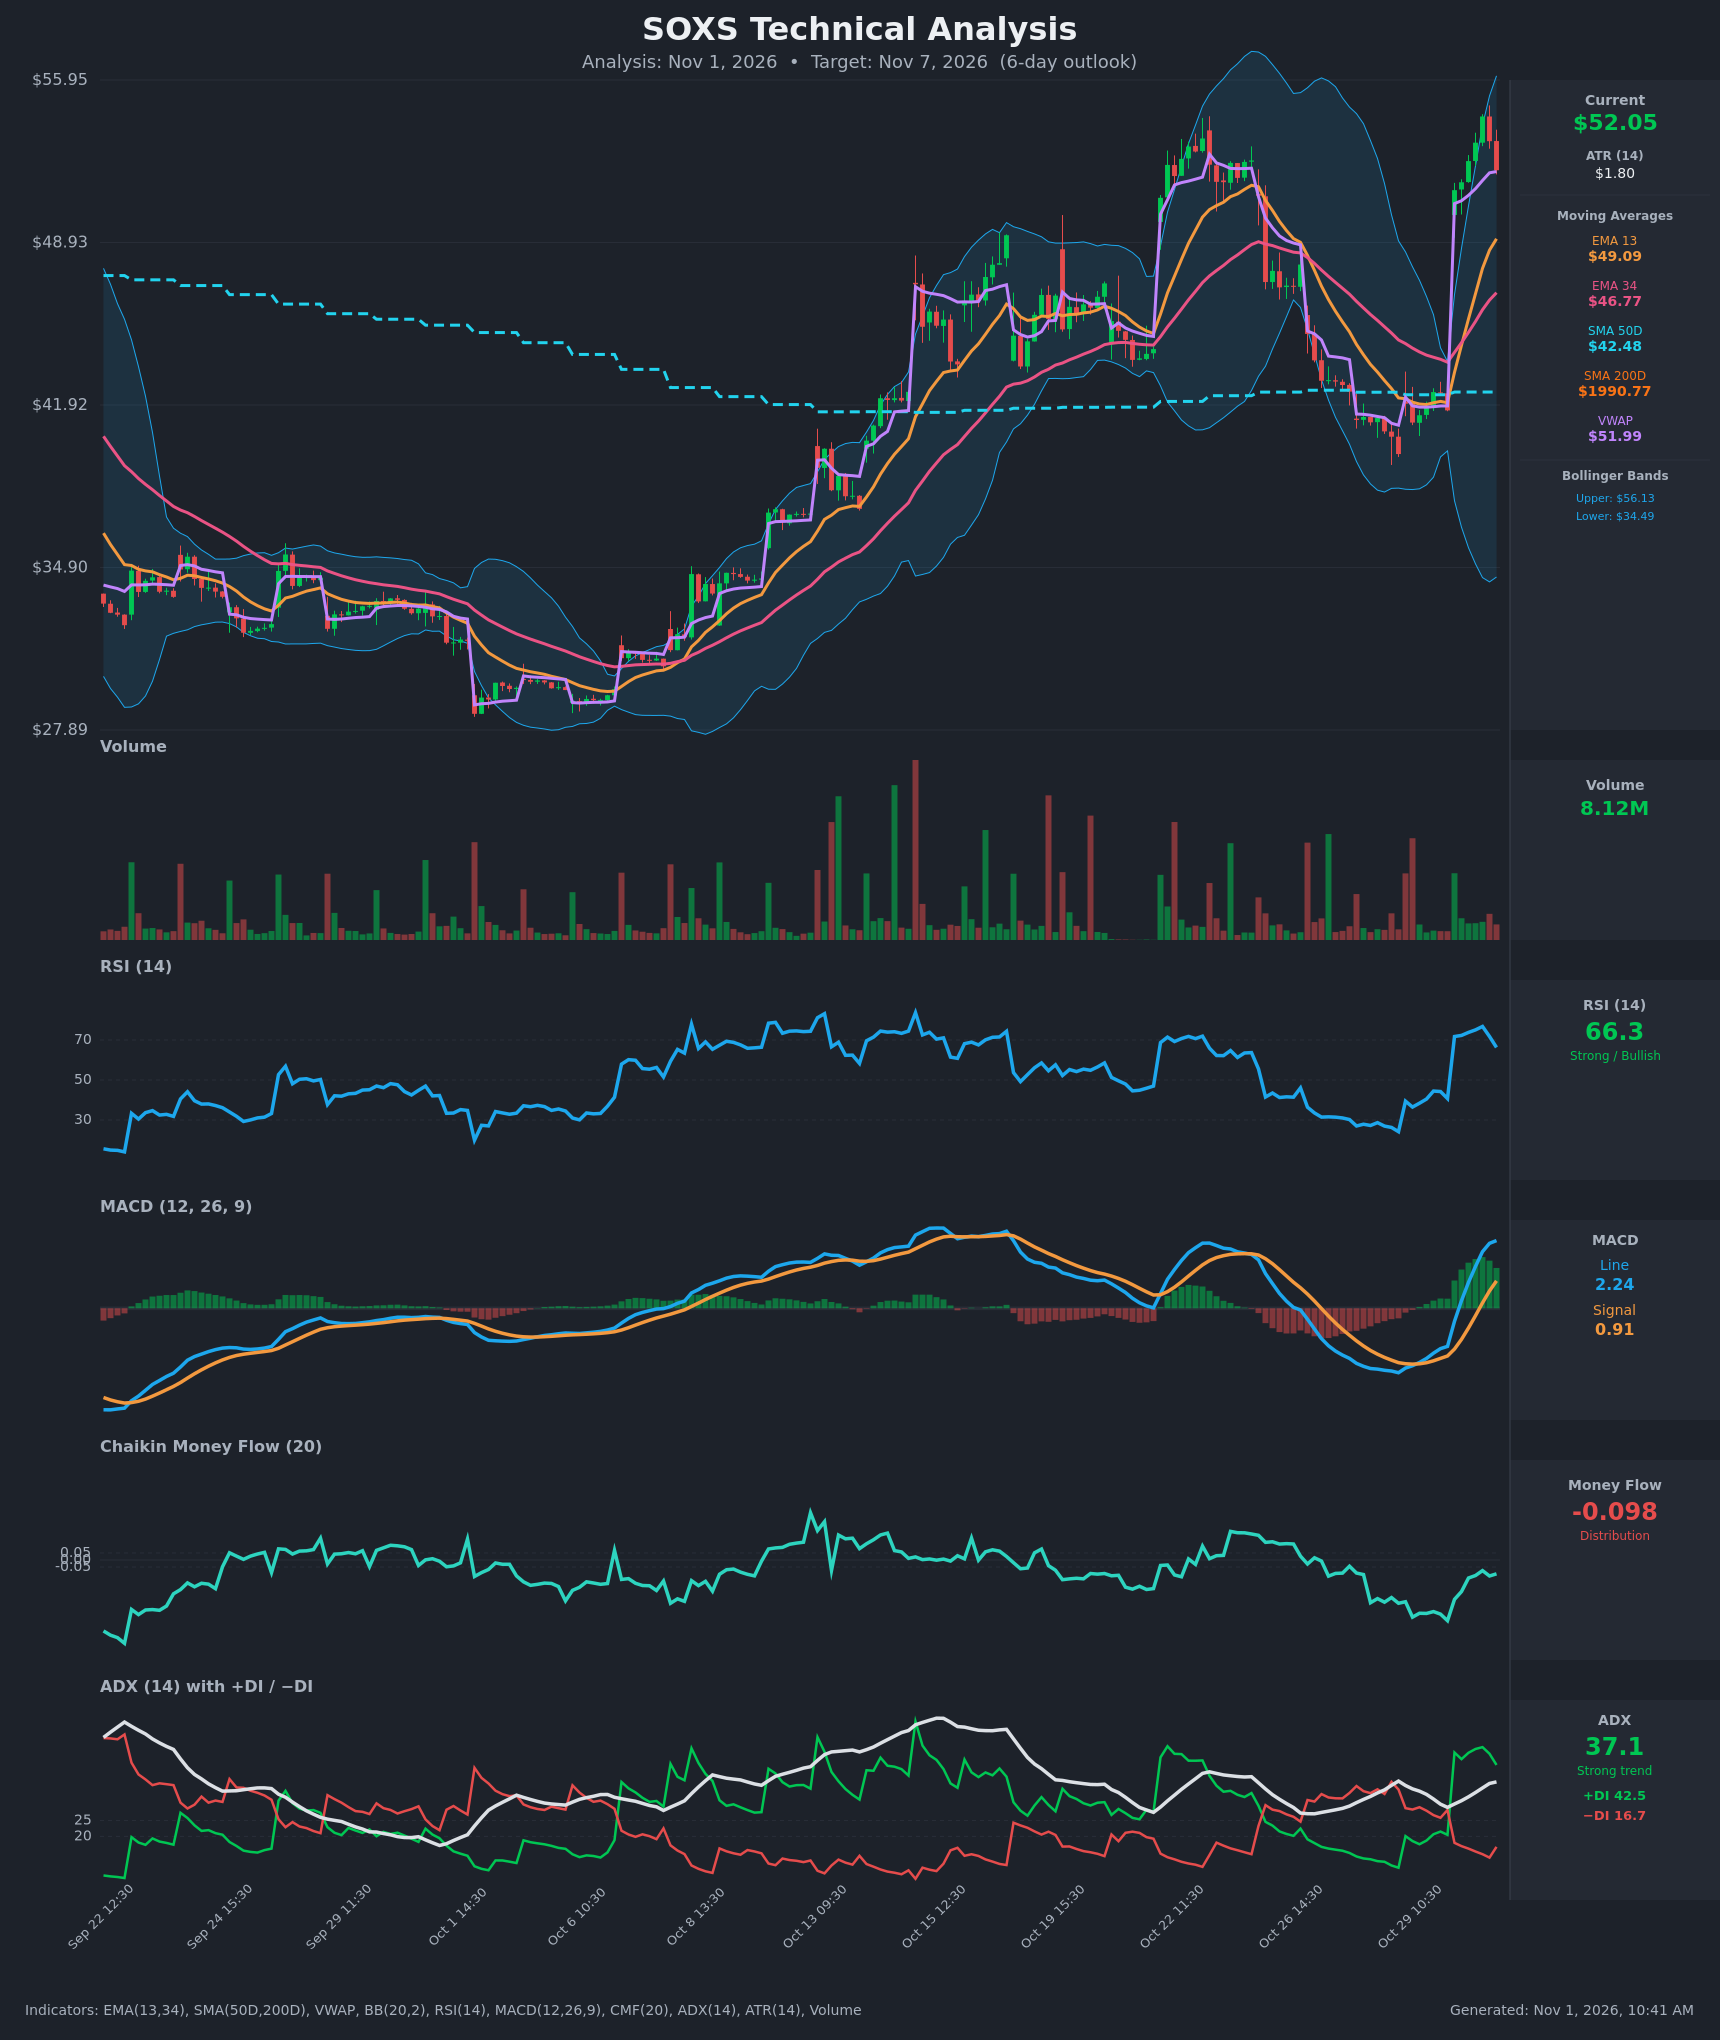
- RSI (14): 66.28, down from a peak of 76.8 two bars ago, so it has rolled over from overbought. Momentum is still strong but fading after a 24-point surge from 40.7 to 76.8. [Neutral]
- 20 EMA: The data gives EMA 13 at $49.09 and EMA 34 at $46.77. Price is above both, and EMA 13 is rising steeply and crossed above EMA 34 on Oct 30. The $52.05 close is about 6% above EMA 13, which is stretched. EMA 13 is the first dynamic support. [Bullish]
- MACD: Line 2.24 vs signal 0.91. It crossed bullishly on Oct 30 and the histogram is positive (+1.33) and expanding. The line's slope is flattening (2.149 to 2.240), which hints at near-term momentum peaking. [Bullish]
- Bollinger Bands (20): Upper $56.13, lower $34.49, with the bands very wide after the gap. Price is in the upper third, below the upper band and rejected from near $54.4. The wide bands point to elevated volatility and mean-reversion risk toward the midline (~$45). [Neutral]
- CMF (20): -0.098, which is distribution. Price rallied about 30% off the lows while CMF stayed negative, so buying is not confirmed by volume flow. [Distribution]
- ADX (14): 37.1 and rising, with +DI 42.5 above −DI 16.7. This is a strong uptrend. +DI has begun to tick down from 48.1, so the trend is likely mature in the short term. [Strong Trend – Bullish]
- Volume: 8.12M, moderate and well below the spikes of mid-October. The last two pullback bars are red, and the breakout has not been accompanied by heavy volume. VWAP is $51.99, so price is sitting right on it. [Neutral / Lacks Confirmation]
DIVERGENCES & TRENDS
- CMF vs. price: Price is up sharply while CMF stays negative at -0.098, a bearish divergence that signals weak accumulation.
- RSI vs. price: RSI peaked at 76.8 on the $54.37 high and has dropped to 66.3 on a $52.05 close. This is bearish momentum rollover, not yet a classic divergence.
- Trend crossovers: EMA 13 is above EMA 34 (bullish cross), the MACD bullish cross is confirmed, and +DI dominates −DI. The trend structure is bullish, but the short-term bars are exhausting.
- Price vs. VWAP: Price has slipped from $54.37 down to the VWAP at about $52. A close below VWAP would shift intraday control to sellers.
- SMA 200D: The reported value ($1,990.77) is clearly distorted, likely by reverse-split adjustment, so I disregard it. SMA 50D at $42.48 is far below price.
CHART PATTERNS
- Gap-and-run (exhaustion risk): The +22.8% gap on Oct 30 followed by a stalling advance resembles a blow-off spike. Price is now retesting the Oct 22 high zone (~$52.5), which sets up a potential Bearish Double Top around $52–54.
- Double-top significance: A break below the interim trough (about $49–50, EMA 13) would confirm it, with a measured move toward the mid-$40s. Over 6 days, a partial move toward $49–50 is the realistic target.
- Bullish counter-case: The shallow pullback within a strong ADX trend could be a Bullish Flag/Pennant continuation. It needs a close above $54.37, with a target near the upper band at $56.1.
POTENTIAL SCENARIOS
- Scenario 1: Bearish Pullback to EMA 13 — The overextended spike fades as RSI cools and CMF distribution weighs on price. Price loses VWAP and drifts toward the rising EMA 13. Trigger: close below $51.50 / VWAP ($51.99). Target: $49.10–$50.20. Invalidation: close above $54.40. (50% probability)
- Scenario 2: Bullish Trend Continuation — The strong ADX and positive MACD carry price to new highs, with a flag breakout. Trigger: close above $54.37 on rising volume. Target: $56.10–$57.50 (upper Bollinger Band). Invalidation: close below $49.10. (35% probability)
- Scenario 3: Neutral Consolidation — Price chops between the VWAP and the recent high while the EMAs catch up. Trigger: holding $50.50–$53.50. Target: ~$52. Invalidation: close outside $49.1–$54.4. (15% probability)
PRICE TARGETS
- Target Price: $50.20 (6-day horizon, about -3.6% from $52.05)
- Expected Range: $48.40 to $52.40 (width $4.00, about 7.7% of current price, consistent with a 6-day horizon)
- Key Levels: Support at $49.09 (EMA 13), Resistance at $54.37 (recent high)
OVERALL BIAS
OVERALL BIAS: BEARISH - Price is stretched about 6% above EMA 13 while RSI rolls over from 76.8 and CMF shows distribution (-0.098), with price stalling near the prior Oct 22 high. This points to a pullback toward the $49–50 EMA/VWAP zone, even though the larger trend (ADX 37, MACD bullish) remains up.
This is educational analysis and not financial advice.