SOXS 62-day bearish forecast — Nov 15, 2026
- Bias: Bearish
- Timeframe: 62 days (made Nov 15, 2026, target date Jan 15, 2027)
- Price at analysis: $50.78
- Price target: $45.50
- Expected range: $38.00 – $53.00
- Result: Pending — graded after the close on Jan 15, 2027
Get a free AI analysis of SOXS today
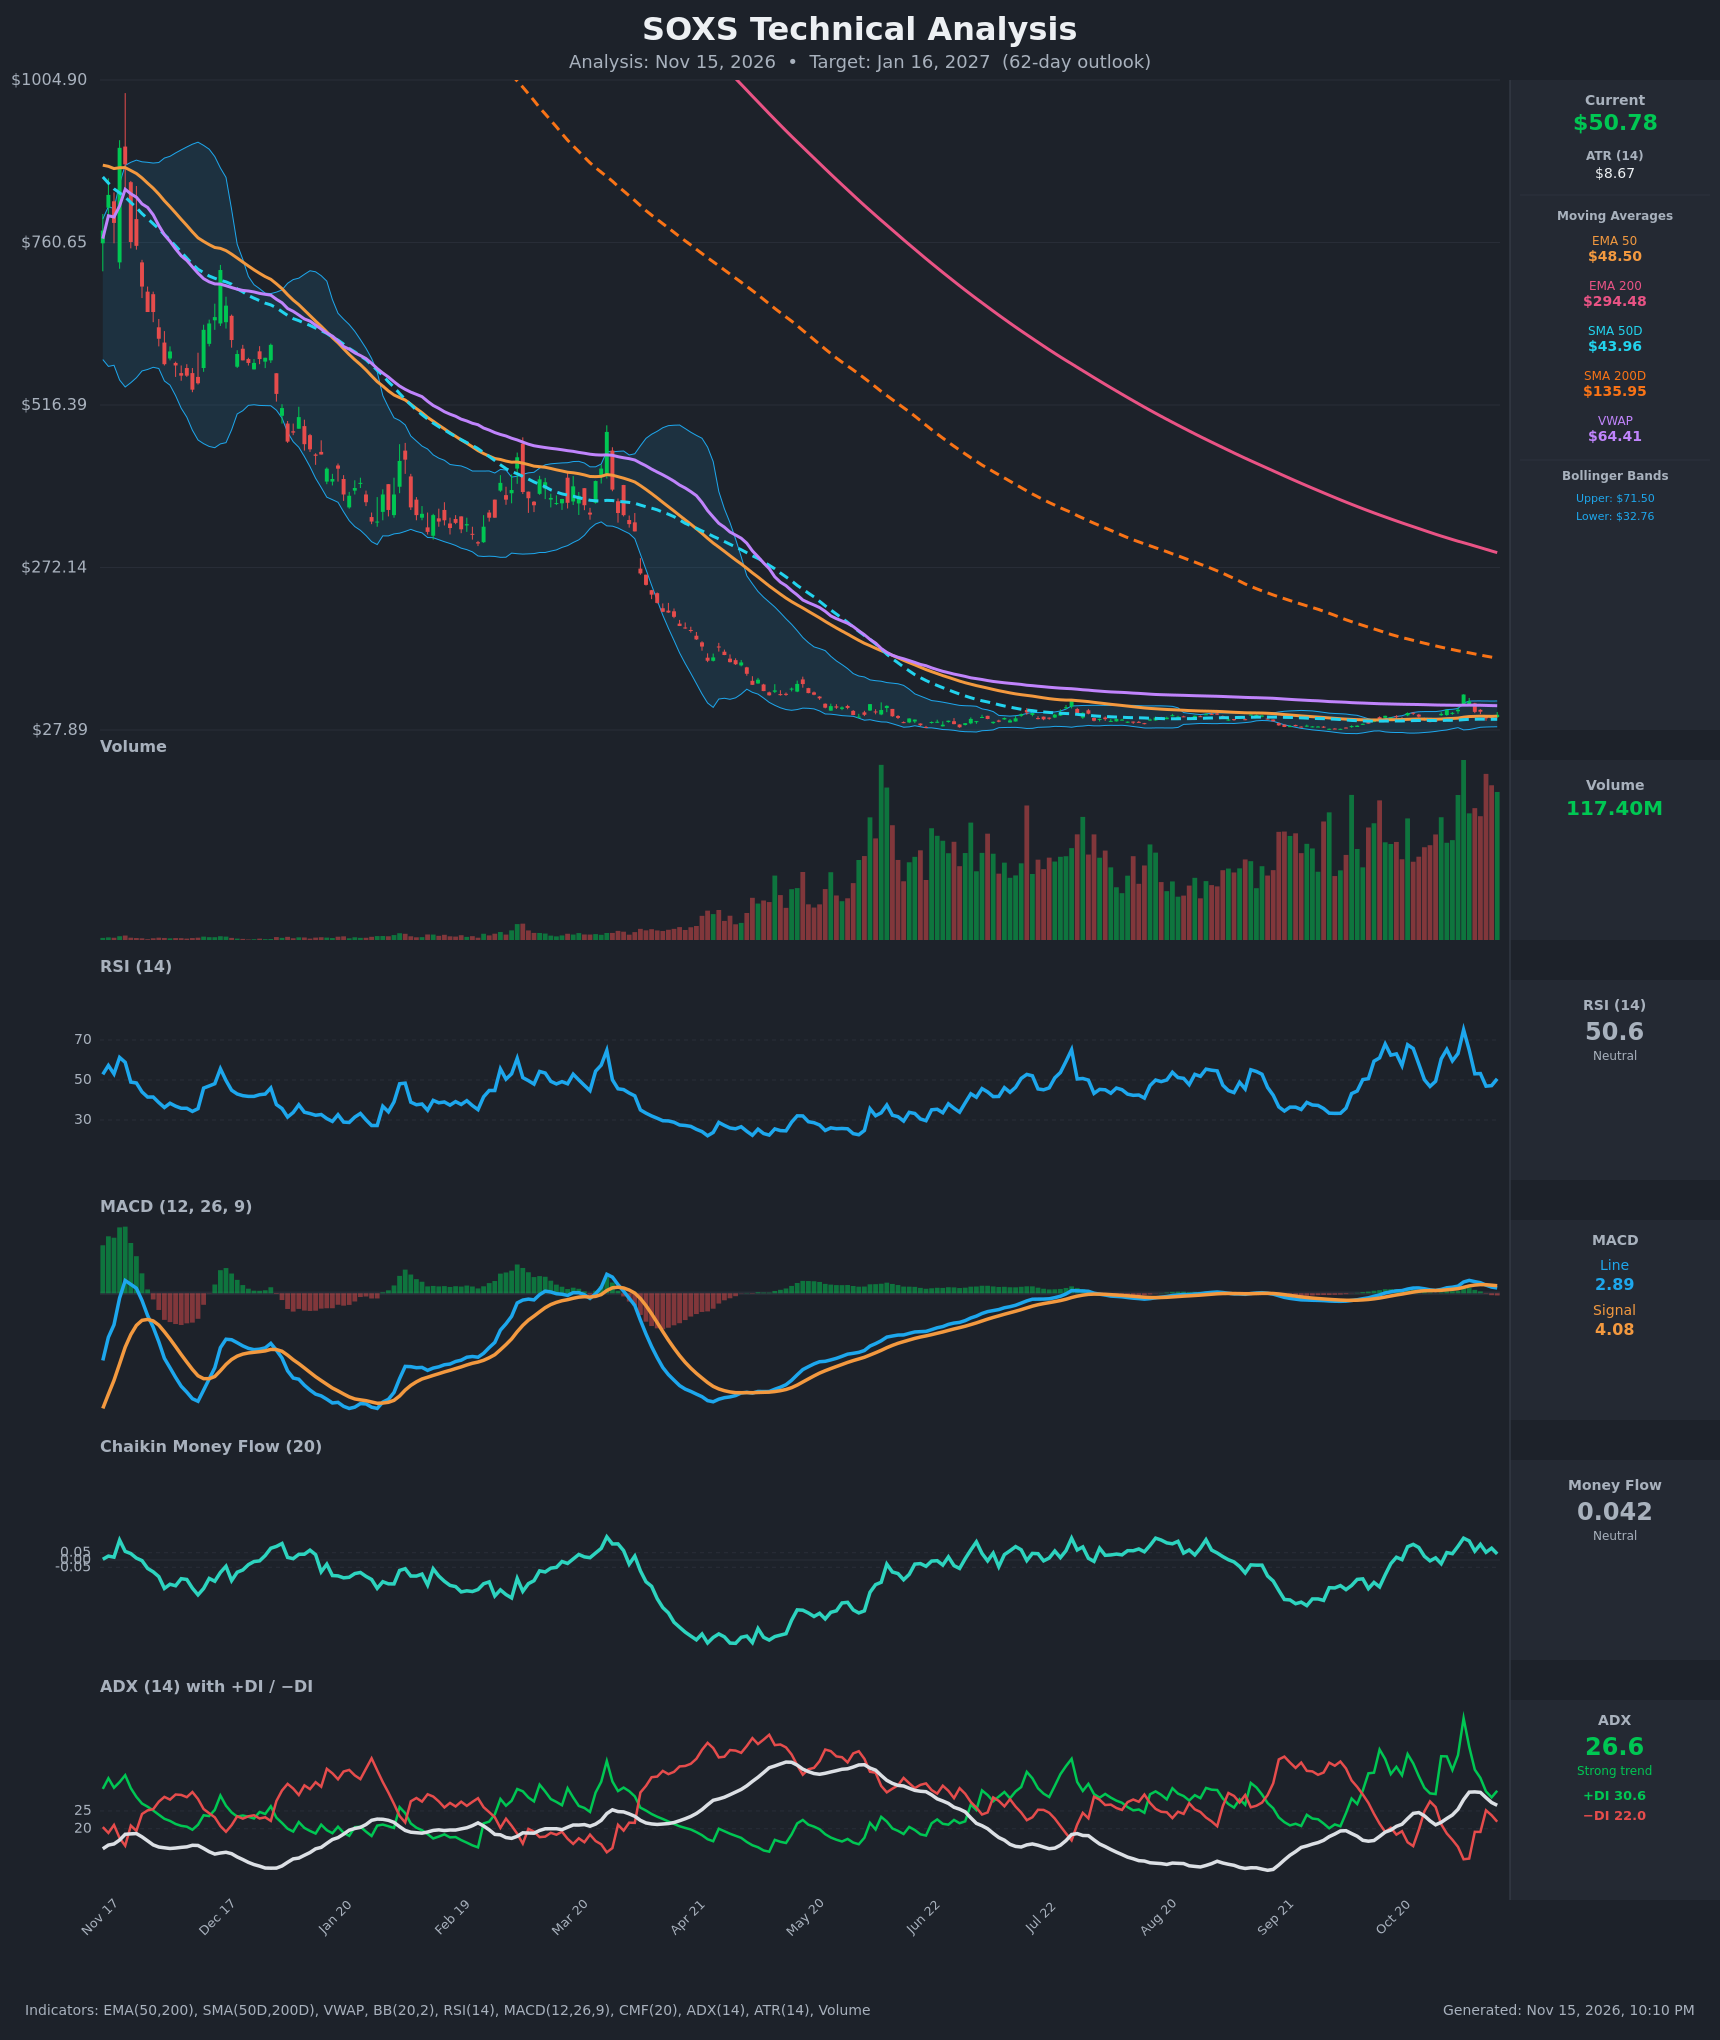
Analysis
TECHNICAL INDICATORS
- RSI (14): 50.59, dead neutral. It fell from the 75 peak on Nov 5 to 47 and has bounced slightly. Momentum has no edge either way. [Neutral]
- 20 EMA: The 20 EMA isn't supplied, so I used the EMA 50 at $48.50. Price at $50.78 is just above it, and the EMA has flattened around $48. EMA 200 ($294.48) and SMA 200D ($135.95) are far overhead and falling, which is heavy long-term resistance. [Neutral]
- MACD: Line 2.89 is below Signal 4.08, a bearish crossover on Nov 11. The line has dropped from 6.96 to 2.89 and the histogram is negative and widening. Momentum is fading after the Nov 5 spike. [Bearish]
- Bollinger Bands (20): Upper $71.50, lower $32.76, mid ≈ $52.1. The bands are wide because of the spike to $81 and the drop back, and price sits right at the midline. This shows high volatility but no directional edge. [Neutral]
- CMF (20): 0.042, just under the +0.05 accumulation threshold. It has stayed mildly positive for months, so there is slight net buying but not conviction. [Neutral]
- ADX (14): 26.6 with +DI 30.6 above −DI 22.0. The ADX is above 25 but falling from 30.3, so trend strength is peaking. Bulls are nominally in control, but the gap has narrowed from 51 vs 11 on Nov 5. [Strong Trend, fading, nominally bullish]
- Volume: 117.4M, near the highest of the whole chart and rising since spring. Heavy volume on both the Nov 5 spike and the reversal shows an aggressive two-way fight. The spike was sold into immediately. [Heavy, contested; distribution on the reversal]
DIVERGENCES & TRENDS
- Price is holding around $45–$58 while MACD momentum is rolling over from its Nov 6 peak. Price has made no new high, so this is momentum fading, not a clean divergence.
- The $81 spike on Nov 5 (RSI 75) fully reversed within five sessions to $45. That is a failed breakout and a bearish rejection.
- The Nov 11 MACD bearish crossover is the most recent signal. The +DI/−DI gap has narrowed from about 40 points to 8.6.
- Price is above EMA 50 and SMA 50D (both rising) but far below SMA 200D and EMA 200, which are falling. There is no golden cross, and the long-term trend is still down. The chart shows a multi-month base after a long structural decline.
- SOXS is a 3x inverse leveraged ETF, so volatility decay is a structural headwind over a 62-day holding period.
CHART PATTERNS
- Base/range consolidation (~$40–$58) after a long downtrend: This is the most visible structure on the right edge. It is similar to a Bullish Falling Wedge or Triple Bottom on the long-term view. The base has not broken out, since $58–$64 (VWAP) caps it.
- Failed spike and reversal: The $81 reversal resembles a Bearish Expanding Triangle, with wide swings and no follow-through. A break below $44 would target the BB lower band near $32–$38.
- Bullish case: A close above $64–$70 would confirm a reversal toward $80+.
- Overall the pattern evidence is mixed, but the failed breakout and MACD cross lean slightly bearish.
POTENTIAL SCENARIOS
- Scenario 1: Bearish Fade Back Into the Range Lows — The failed spike, bearish MACD cross, falling ADX and leveraged-ETF decay pull price back toward SMA 50D support. Trigger: close below $48.50 (EMA 50), then below $43.96. Target: $44–$38 (BB lower band $32.76 in an extreme case). Invalidation: daily close above $58.30. (45% probability)
- Scenario 2: Bullish Base Breakout — +DI dominance and mild CMF accumulation fuel another volatility spike, and this time it holds. Trigger: close above $58.30, then above VWAP at $64.41. Target: $64–$72 (BB upper $71.50). Invalidation: close below $43.96. (35% probability)
- Scenario 3: Neutral Chop — Price stays between $44 and $58, with ADX decaying below 25. Trigger: failure to break either side of the range. Target: $48–$54. Invalidation: close outside $43.96–$58.30. (20% probability)
PRICE TARGETS
- Target Price: $45.50 (62 days, Jan 16, 2027)
- Expected Range: $38.00 to $53.00 (width $15.00 ≈ 29.5%, in line with the 61–180 day guidance and appropriate given ATR of $8.67 ≈ 17% of price)
- Key Levels: Support at $48.50 (EMA 50, then $43.96 SMA 50D), Resistance at $58.30 (recent swing highs, then $64.41 VWAP)
OVERALL BIAS
OVERALL BIAS: BEARISH - The Nov 5 spike failed and fully reversed, MACD has crossed bearish with a widening negative histogram, and ADX is fading. Price is also far below the long-term 200-day averages, and structural decay in a 3x inverse ETF adds a drift lower. Conviction is modest, since price is above the rising 50-period averages and +DI still leads.
This is educational analysis and not financial advice.