SOXS 27-day bearish forecast — Nov 15, 2026
- Bias: Bearish
- Timeframe: 27 days (made Nov 15, 2026, target date Dec 11, 2026)
- Price at analysis: $50.78
- Price target: $46.50
- Expected range: $41.50 – $50.50
- Result: Pending — graded after the close on Dec 11, 2026
Get a free AI analysis of SOXS today
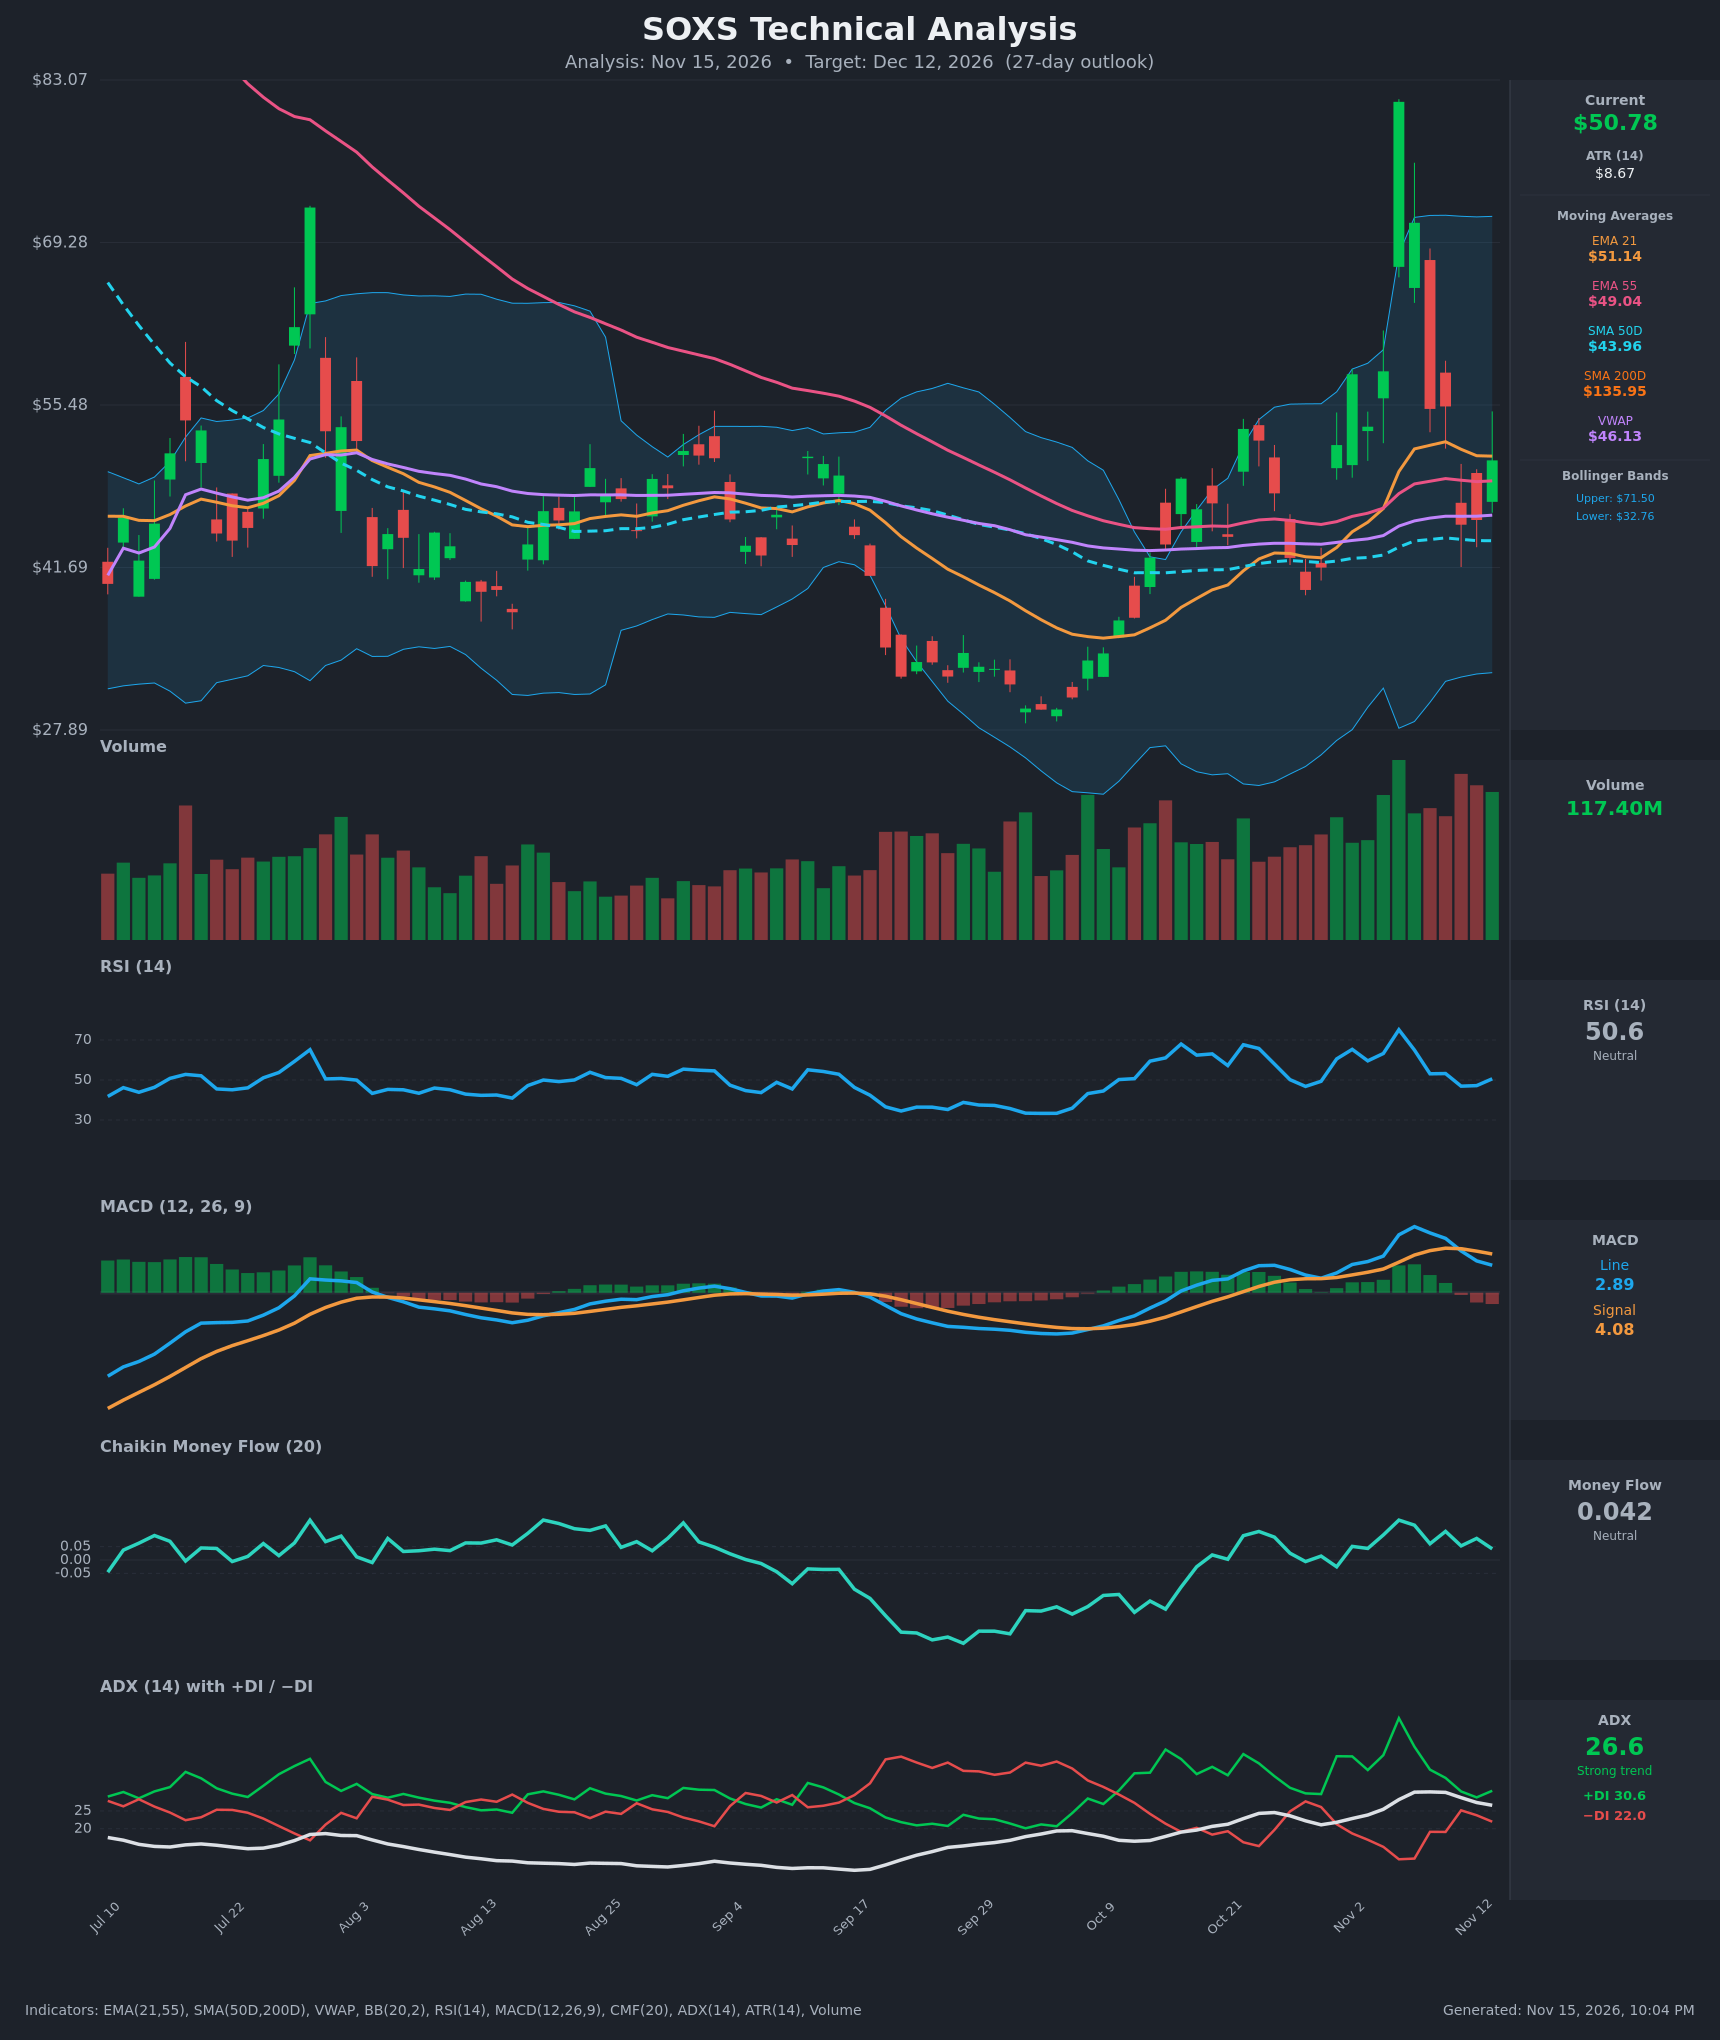
Analysis
TECHNICAL INDICATORS
- RSI (14): 50.59, mid-range. It has fallen from the 75.1 overbought spike on Nov 5 and has stalled around 47-53 over the last week. Momentum is flat to slightly improving after the 47 low. [Neutral]
- 20 EMA (EMA 21): $51.14. Price at $50.78 is just below it, so the EMA is acting as near-term resistance. EMA21 has turned flat/down after peaking near $52.36, and it remains above EMA55 ($49.04), so there is no bearish EMA cross yet. Price is still above EMA55, SMA50D ($43.96) and VWAP ($46.13). [Neutral]
- MACD: Line 2.89 is below Signal 4.08, a bearish crossover that occurred around Nov 11. The histogram is negative (about -1.2) and widening, and the line has fallen from its 6.96 peak. [Bearish]
- Bollinger Bands (20): Upper $71.50, lower $32.76, midline about $52.1. The bands are very wide after the spike to ~$81, which signals extreme volatility. Price sits just under the midline, so there is no squeeze or extreme reading, and the midline is slight resistance. [Neutral]
- CMF (20): 0.042, between ±0.05. It has stayed mildly positive since mid-Oct but is fading from the 0.149 peak. Accumulation is weakening. [Neutral]
- ADX (14): 26.6 with +DI 30.6 over −DI 22.0. This is a trend-strength reading above 25, but ADX is falling from 30.3 and the DI spread has narrowed sharply from 51/11. Bulls are still on top, but the trend is losing steam. [Strong Trend, fading, bullish-leaning DI]
- Volume: 117.40M, among the heaviest bars on the chart. It has been elevated since the Nov 5 spike, including on the red reversal bars (Nov 6-11). The heavy volume on down bars shows distribution into the spike. [Elevated volume, distribution on rallies]
DIVERGENCES & TRENDS
- Price made a blow-off high near $81 on Nov 5 and has retraced about 38% of the spike low-to-high move. Subsequent closes ($55 → $45 → $50.78) are lower highs.
- MACD has crossed bearishly, and its histogram has gone negative while price is still above the 50-day average. Momentum is deteriorating faster than price.
- RSI shows a lower high (75 → 53) and is flat at 50. The DI spread is narrowing, which means trend strength is rolling over.
- The longer trend since the late-Sep low (~$29) is an uptrend of higher lows (~$40 on Oct 28, ~$45 on Nov 11). It is still intact above SMA50D, but it is being tested.
- SMA200D ($135.95) is far above price and falling, which is distorted by the ETF's history (likely reverse splits). I treat it as a macro downtrend marker with limited tactical value. A death cross is already in place, since SMA50D is far below SMA200D.
- No EMA21/55 bearish cross yet, but the gap is just $2.10 and narrowing.
CHART PATTERNS
- Bearish blow-off / failed spike: A one-bar thrust to ~$81 was fully rejected. The pattern behaves like a bearish expanding-triangle or rising-wedge fakeout, with a lower high and a rejection at the upper Bollinger Band.
- Base from late September: A rounded bottom with higher lows, similar in spirit to a bullish double bottom or inverted head and shoulders. It supports dips toward $43-46.
- Current structure: Price is compressing between ~$45 and ~$55 after the spike, which looks like a possible symmetrical triangle or bearish pennant after the sharp move. A break below ~$45 would point toward the $40-41 area (the Oct 28 low zone, which is also the pennant measured move). A close above $58 would negate the bearish read.
POTENTIAL SCENARIOS
- Scenario 1: Bearish Fade Toward VWAP and Support — The bearish MACD cross, fading ADX and CMF, and the rejected blow-off keep price capped below the EMA21 and the Bollinger midline. Price drifts toward VWAP, with leveraged-ETF decay adding pressure. Trigger: close below EMA55 ($49.04), then below $46.13 (VWAP). Target: $46.50, with an extension to $42-43 (SMA50D $43.96 area). Invalidation: daily close above $55.40. (50% probability)
- Scenario 2: Bullish Higher-Low Continuation — The uptrend of higher lows holds, +DI stays above −DI, and price reclaims the EMA21. Another volatility burst in the underlying inverse trade lifts price. Trigger: close above $52.10 (BB midline) with MACD re-crossing up. Target: $58-62. Invalidation: close below $44. (30% probability)
- Scenario 3: Neutral Range Chop — Price oscillates between ~$45 and ~$55 as ADX falls below 25. Trigger: ADX under 25 and RSI holding 45-55. Target: $48-52. Invalidation: close outside $44-$56. (20% probability)
PRICE TARGETS
- Target Price: $46.50 (27-day)
- Expected Range: $41.50 to $50.50 (width $9.00, about 17.7% of current price, consistent with the 30-60 day guidance and the ATR-driven volatility)
- Key Levels: Support at $46.13 (VWAP, with EMA55 at $49.04 as the first layer), Resistance at $55.36 (Nov 10 swing close, with EMA21 at $51.14 as the first hurdle)
OVERALL BIAS
OVERALL BIAS: BEARISH - A bearish MACD crossover and negative histogram, price below the EMA21 after a rejected blow-off spike, and fading ADX/CMF outweigh the still-positive +DI and the price position above EMA55, SMA50D and VWAP. Conviction is modest given the extreme volatility.
This is educational analysis and not financial advice.