SOXS 34-day bearish forecast — Nov 15, 2026
- Bias: Bearish
- Timeframe: 34 days (made Nov 15, 2026, target date Dec 18, 2026)
- Price at analysis: $50.78
- Price target: $47.00
- Expected range: $44.50 – $54.00
- Result: Pending — graded after the close on Dec 18, 2026
Get a free AI analysis of SOXS today
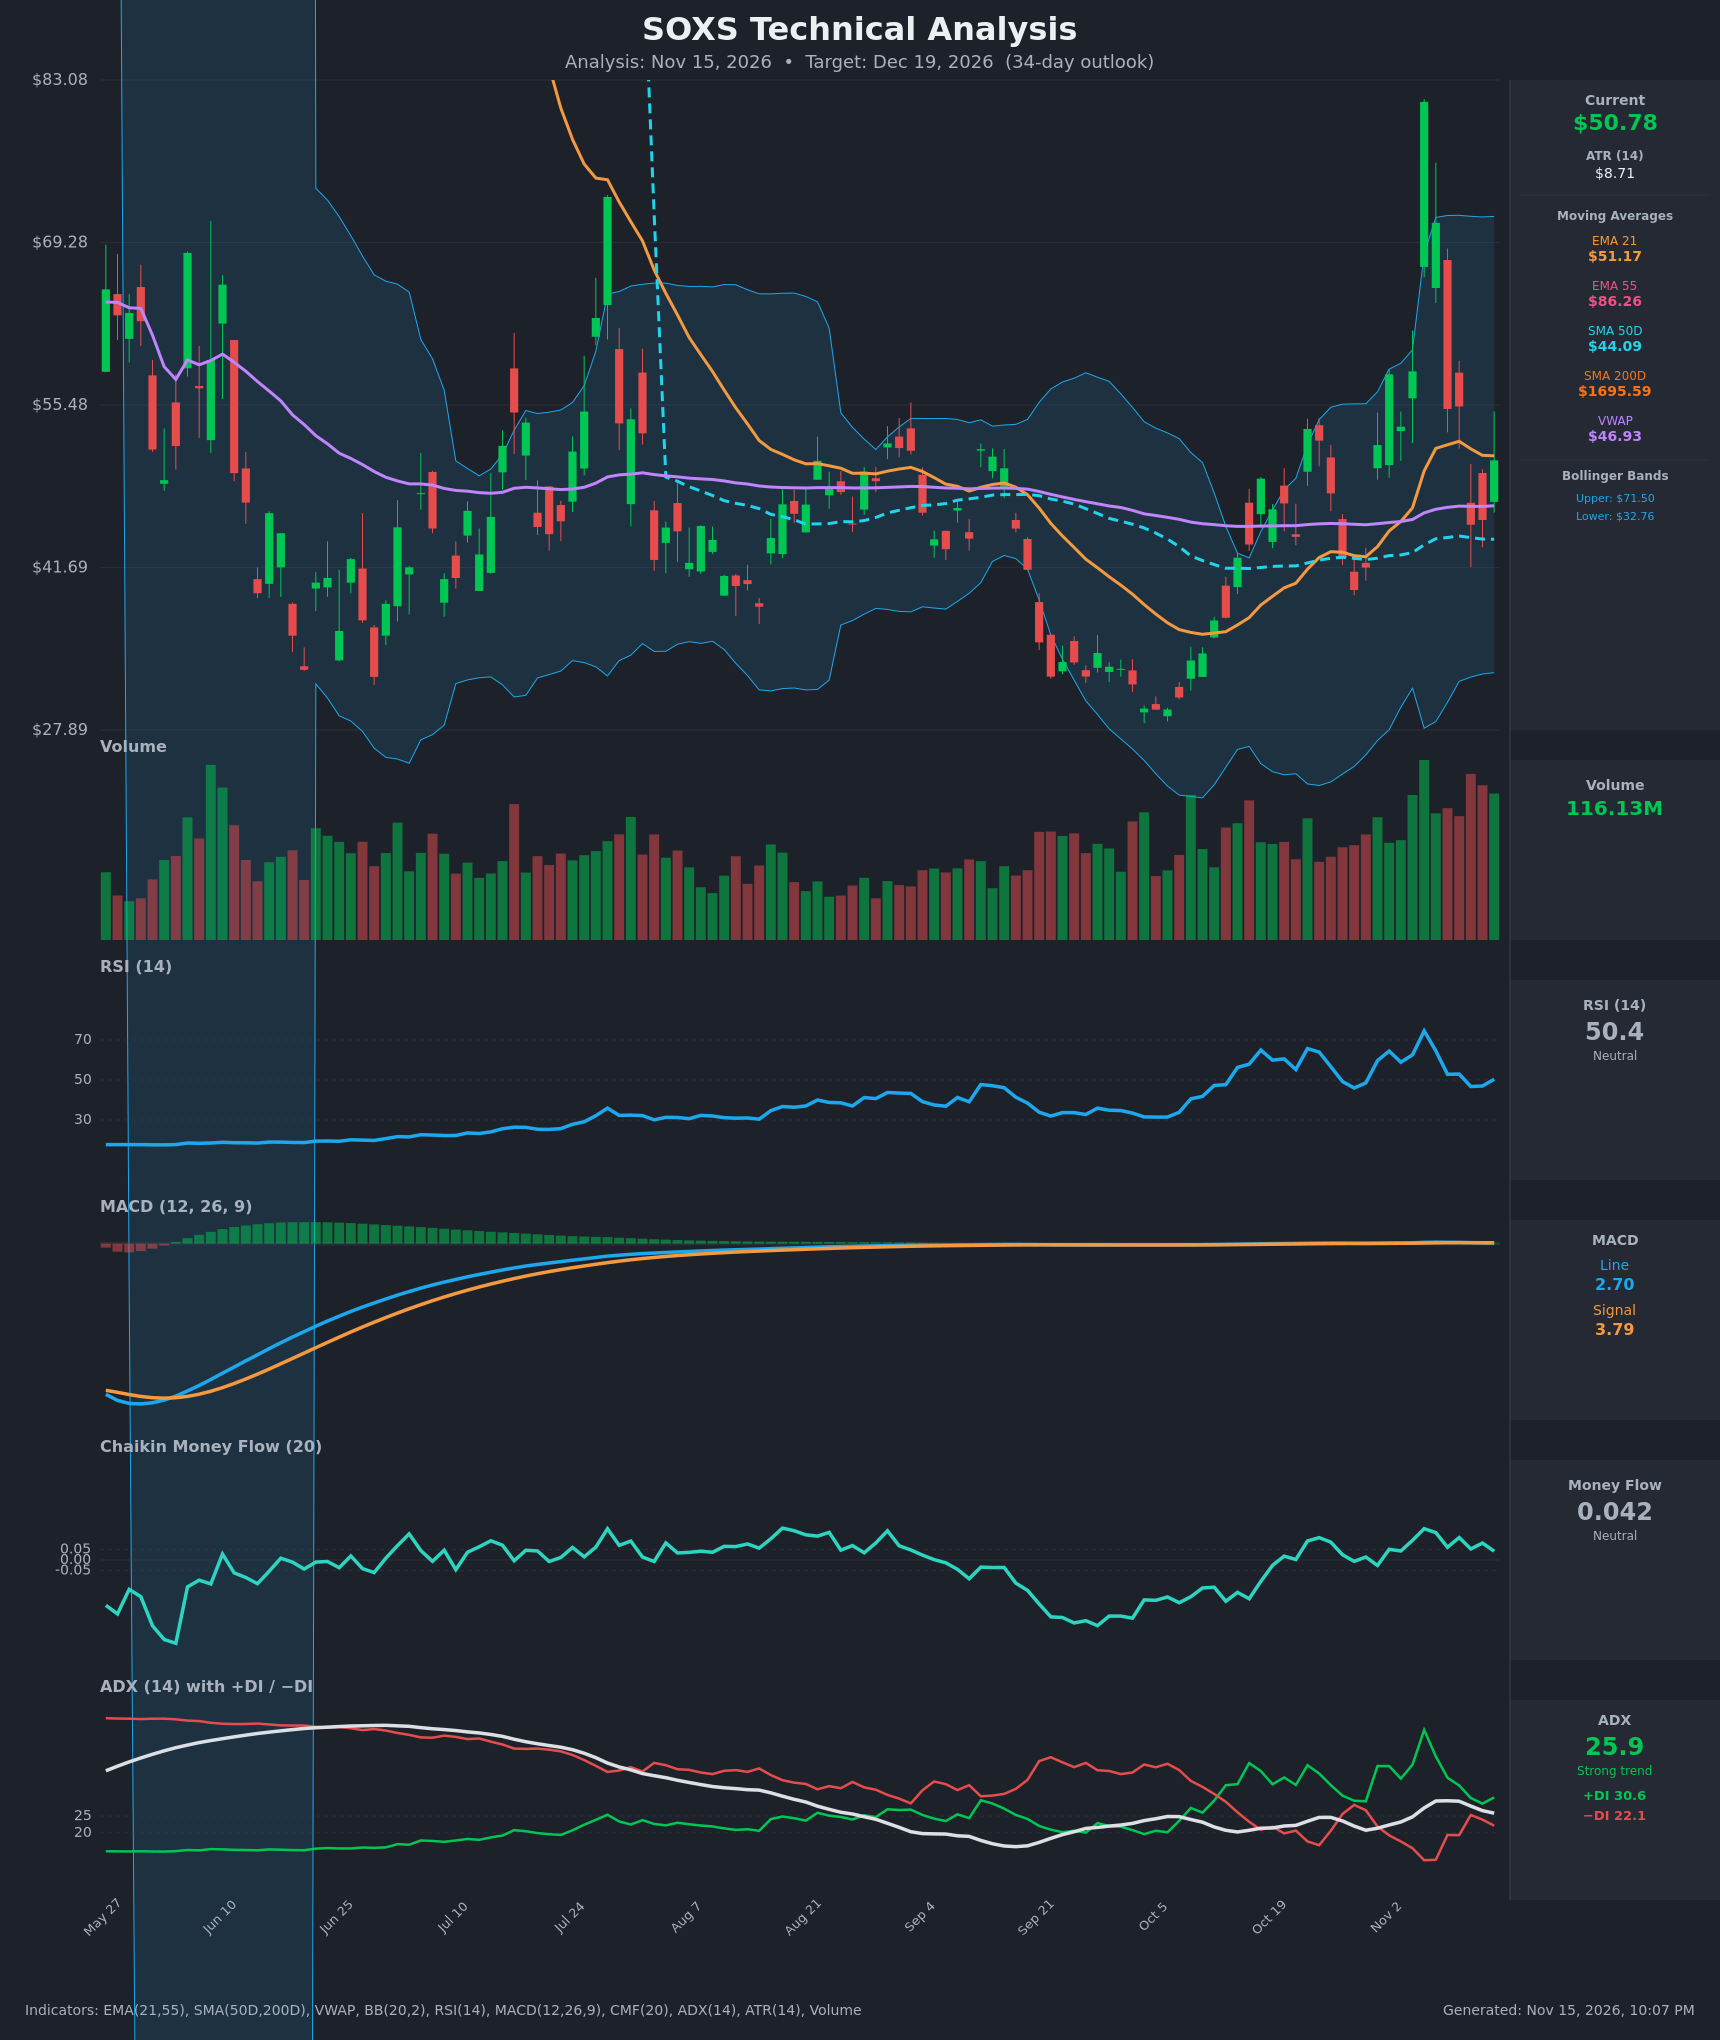
Analysis
TECHNICAL INDICATORS
- RSI (14): 50.40, dead neutral. It has fallen from 74.5 on Nov 5 to the 46-53 zone and is now bouncing slightly (47.0 → 50.4). Momentum has cooled from overbought without reaching oversold. [Neutral]
- 20 EMA: EMA 21 is $51.17 and price is $50.78, just below it. The EMA is rolling over from $52.40, so it acts as marginal resistance. The 21-day EMA is still well above its late-October low of about $42.6, so the broader short-term uptrend is intact. [Neutral]
- MACD: The line is 2.70 against a signal of 3.79, a negative histogram of about -1.09. The bearish crossover occurred on Nov 11 and the line has fallen from a 6.67 peak. Momentum is fading. [Bearish]
- Bollinger Bands (20): Upper is $71.50 and lower is $32.76, with a midline near $52. The bands are very wide after the Nov 5 spike to $81. Price sits just below the midline, so there is no squeeze or band-edge signal. The wide bands reflect volatility that is likely to persist. [Neutral]
- CMF (20): 0.042, inside the ±0.05 neutral zone. It stayed positive (0.04-0.15) through the recent bounce but is slipping below its 0.148 peak, so buying pressure is mild and waning. [Neutral]
- ADX (14): 25.9, down from 29.6, with +DI at 30.6 above −DI at 22.1. The trend is moderately strong but ADX is declining, so the up-move is losing steam. The +DI/−DI spread narrowed at the Nov 11 low and has widened only modestly since. [Strong Trend, Bullish lean but weakening]
- Volume: 116.13M, elevated and consistent with recent heavy sessions. The largest volume bars came on the Nov 5 spike and the reversal days after it. High volume on the fall from $81 to $55 shows sellers absorbing the spike, and today's rebound is not clearly backed by outsized buying. [Mixed / Slightly Bearish]
- Moving averages (note on data): SMA50D is $44.09, so price is above it, and VWAP is $46.93, so price is above it too. These are medium-term supports. The EMA55 ($86.26) and SMA200D ($1,695.59) are distorted by this inverse ETF's reverse splits, so they carry no useful technical weight. The apparent "death cross" is a split artifact, not a signal. [Bullish near-term, long-term MAs unreliable]
DIVERGENCES & TRENDS
- Momentum divergence: Price made a spike high at $81.22 (Nov 5) with RSI at 74.5. Price has since retraced about 37%, and MACD and RSI have both rolled over together, so there is no hidden divergence. The momentum peak is simply behind us.
- MACD: The bearish line/signal crossover on Nov 11 is the key recent break. The histogram has been negative for 3 sessions.
- ADX: ADX peaked near 29.6 and is fading. The bullish DI stack is intact but narrowing.
- Price versus EMA21: Price lost EMA21 on Nov 11-12 and is now retesting it from below. Price is also above VWAP and SMA50D, which are the nearest supports.
- Structural factor: SOXS is a 3x inverse leveraged ETF. Volatility decay tends to erode its value over multi-week holds unless semiconductors keep falling. The Sep-Oct base around $29-$32 was a clear low, and the rally since then has been choppy.
CHART PATTERNS
- Bearish Expanding Triangle (broadening formation): The swings since late October are widening (low $39.78, high $81.22, then a retrace to $45.32). This fits the broadening structure in the reference diagram, and the diagram's reversal bias is bearish. The pattern is imperfect given the single-spike nature of the high, so confidence is moderate.
- Bullish Double Bottom (completed): The Sep-Oct lows near $29-$30 produced the rally and the bounce toward $81. That pattern has played out, and price is now giving back part of the gain.
- Current range: Price is consolidating between about $45 (Nov 11-12 lows) and $58 (Nov 2-4 and Nov 9-10 highs). A break below $44-$45 would target the $39.78 low. A close above $58 would reopen $70+.
- Targets: A broadening-pattern breakdown measures toward $40-$42. The nearer support is the SMA50D at about $44.
POTENTIAL SCENARIOS
- Scenario 1: Bearish Fade Toward SMA50D — Momentum is already rolling over and price is stuck under the declining EMA21. The Nov 5 spike has been rejected, and 3x inverse ETFs tend to bleed when volatility compresses. Trigger: daily close below $45.30 (Nov 11 low) with MACD staying negative. Target: $44-$47, extending to $40-$42 on a break of SMA50D. Invalidation: daily close above $58. (50% probability)
- Scenario 2: Bullish Re-Acceleration — The DI stack remains bullish, price is above VWAP and SMA50D, and CMF is still positive. A renewed semiconductor selloff could push SOXS back toward the recent highs. Trigger: close above $55.40 with a MACD re-cross above signal. Target: $58-$65. Invalidation: close below $45. (30% probability)
- Scenario 3: Neutral Range Chop — Price oscillates in the $45-$57 range with RSI near 50 and ADX falling toward 20. Trigger: failure to break either $45 or $58. Target: $48-$54. Invalidation: close outside the $44-$58 range. (20% probability)
PRICE TARGETS
For the 34-day horizon (to Dec 19, 2026):
Range check: width $9.50 ($54.00 - $44.50) is about 18.7% of $50.78, at the upper edge of the 12-18% guidance for a 30-60 day timeframe. That is appropriate given the high ATR of $8.71.
- Target Price: $47.00 (about -7.4% from current)
- Expected Range: $44.50 to $54.00
- Key Levels: Support at $44.09 (SMA50D), Resistance at $55.40 (recent swing high, with $51.17 EMA21 as the first hurdle)
OVERALL BIAS
OVERALL BIAS: BEARISH - MACD has crossed bearish and is below signal. Price is struggling under the falling EMA21 after rejection from the $81 spike. ADX is fading, the broadening pattern leans bearish, and 3x inverse ETF decay favors drift toward the $44 SMA50D. Conviction is modest, since the +DI lead and positive CMF still show some underlying support.
This is educational analysis and not financial advice.