SOXS 48-day bearish forecast — Nov 15, 2026
- Bias: Bearish
- Timeframe: 48 days (made Nov 15, 2026, target date Jan 1, 2027)
- Price at analysis: $50.78
- Price target: $46.50
- Expected range: $42.50 – $51.50
- Result: Pending — graded after the close on Jan 1, 2027
Get a free AI analysis of SOXS today
Analysis
TECHNICAL INDICATORS
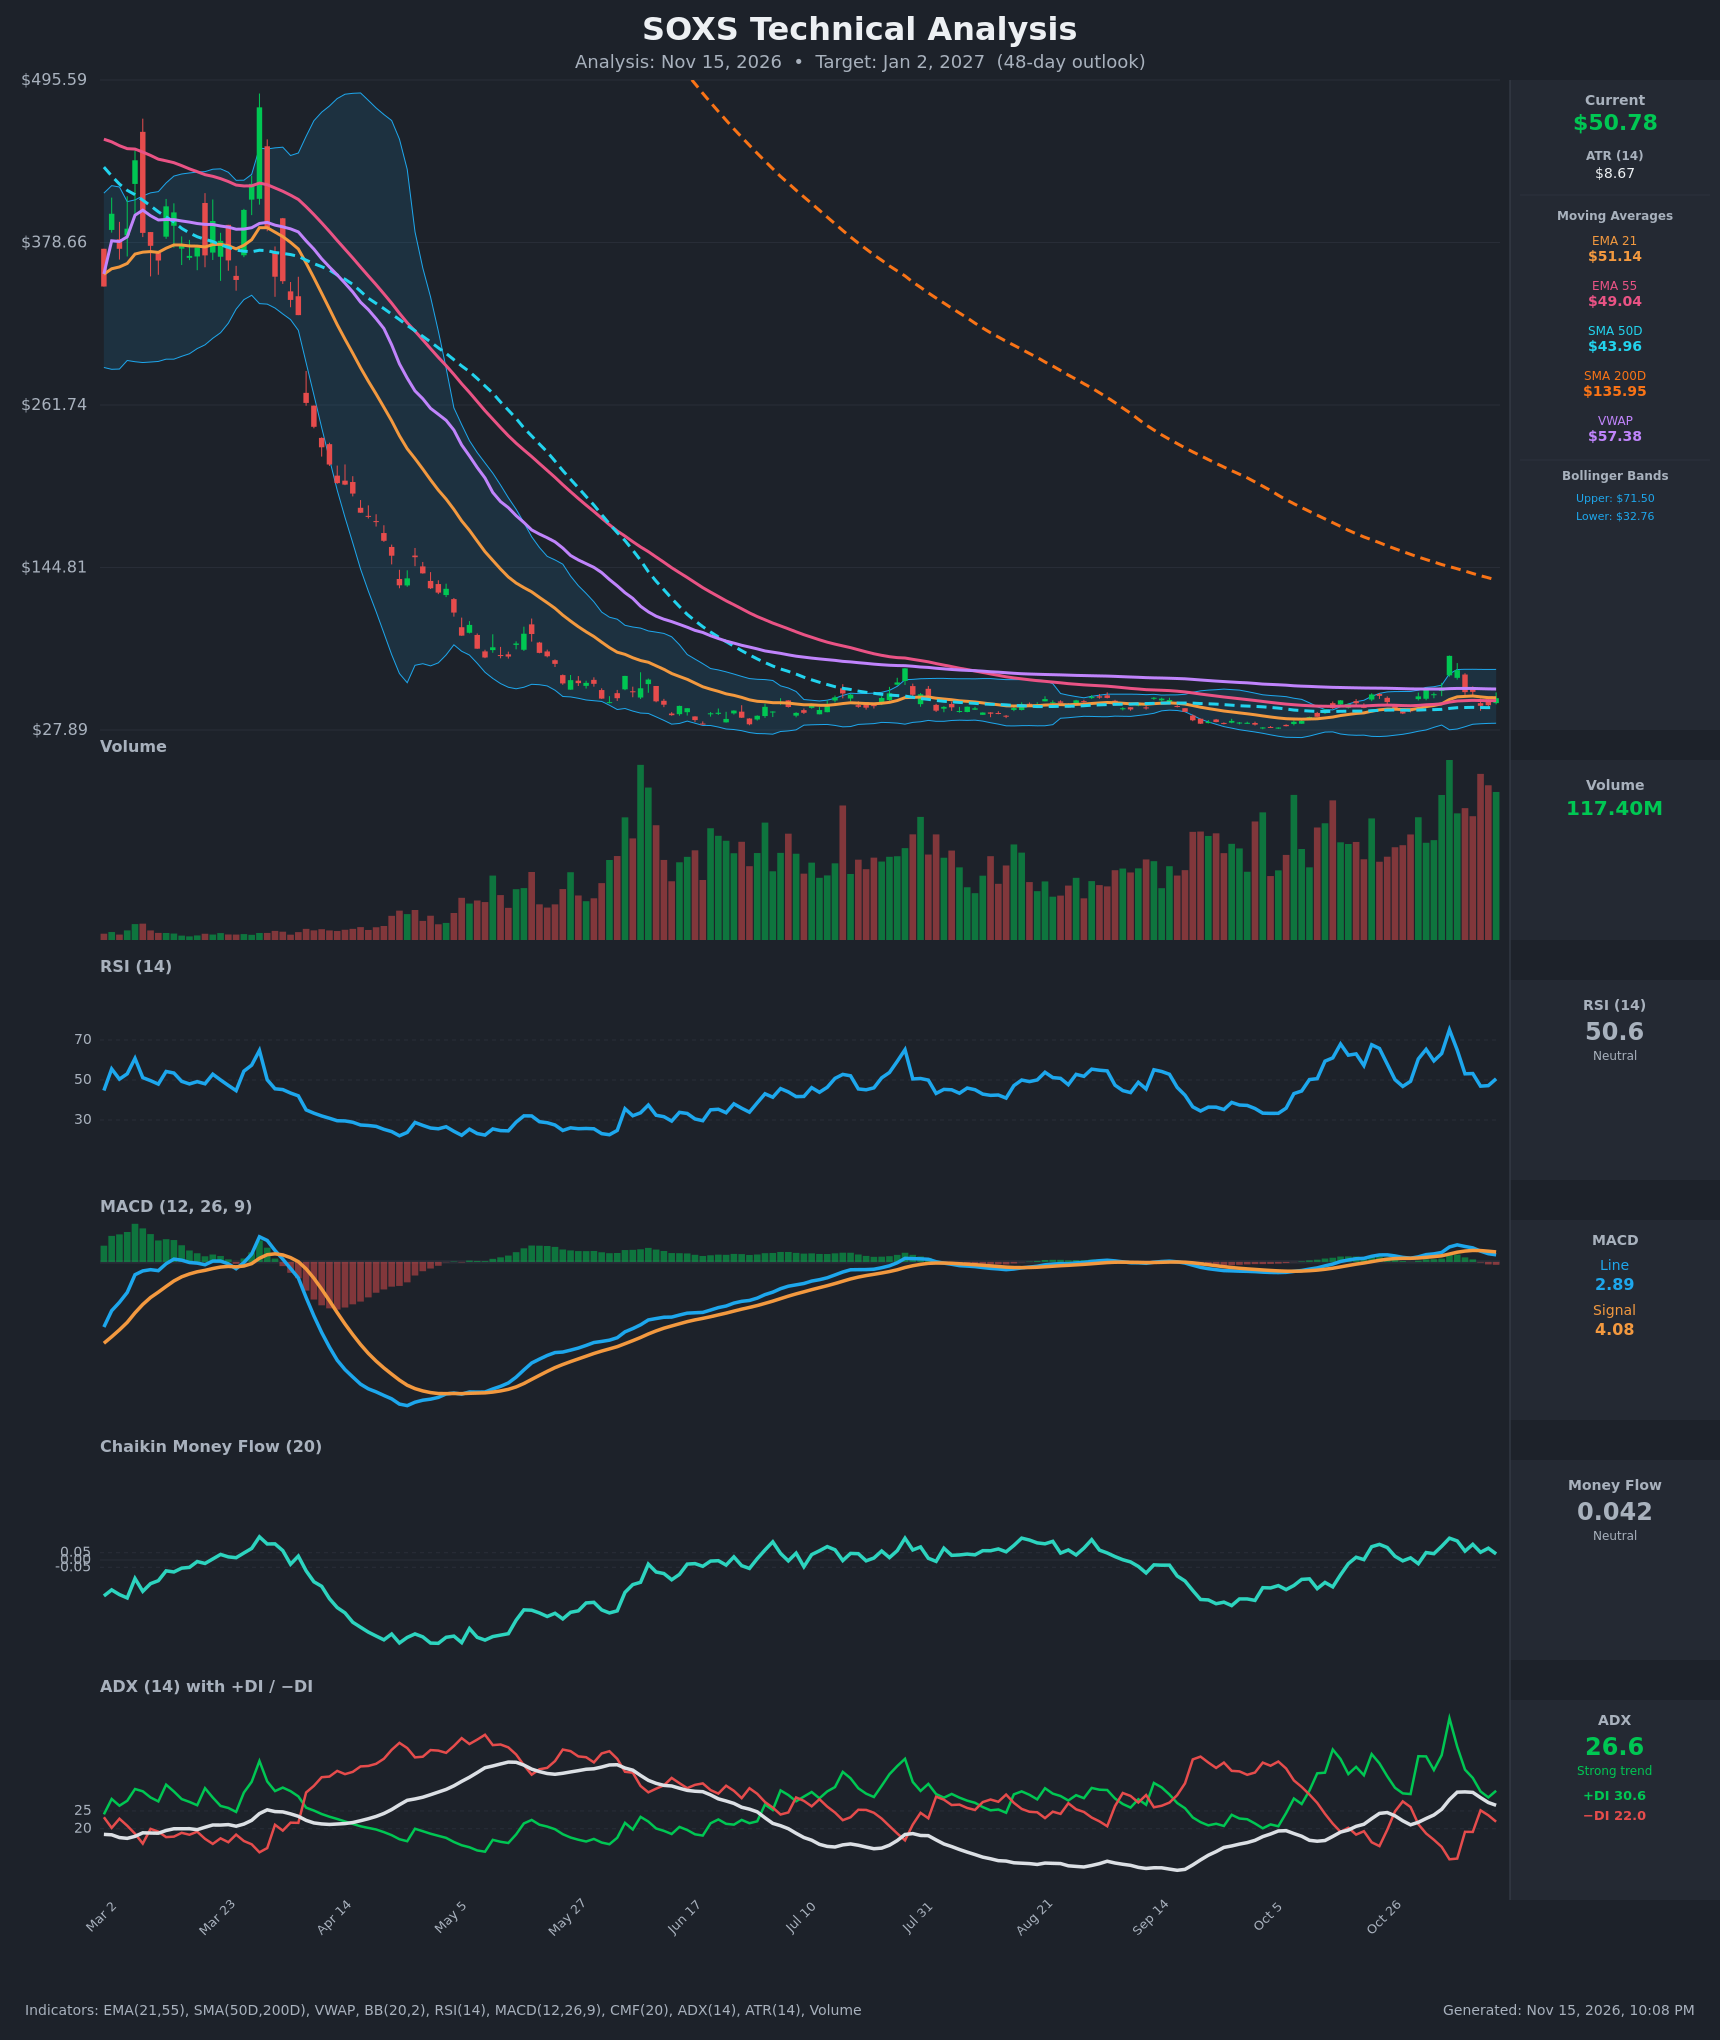
- RSI (14): 50.59, dead centre after peaking at 75.1 on Nov 5 and falling back through 47. The latest bounce from 46.9 is modest. Momentum is neutral, with no overbought or oversold signal. [Neutral]
- 20 EMA: The 21 EMA is $51.14 and price ($50.78) is just below it, so it acts as immediate resistance. Price sits above the 55 EMA ($49.04) and the 50-day SMA ($43.96). EMA21 is above EMA55, a mild short-term bullish alignment that is flattening and rolling over. [Neutral]
- MACD: The line (2.89) is below the signal (4.08), a bearish crossover on Nov 11. The histogram is negative (about -1.2) and has been shrinking for several sessions. Both lines are still positive but declining. [Bearish]
- Bollinger Bands (20): Upper $71.50, lower $32.76, so the bands are very wide at about 76% of price. This reflects the Nov 5 spike to $81 and the volatility since. Price is near the midline (about $52), which is neutral. After the failed push toward the upper band, mean reversion is more likely than expansion. [Neutral]
- CMF (20): 0.042, just under the +0.05 accumulation threshold and positive for most of the recent window. It peaked at 0.149 on Nov 5 and is drifting lower, so buying pressure is fading. [Neutral]
- ADX (14): 26.6 with +DI at 30.6 and −DI at 22.0. The trend is technically strong with bulls on top. ADX has fallen from 30.3 and the DI spread has narrowed from 40/11 to 31/22, so the bullish trend is losing strength. [Strong Trend, bullish but weakening]
- Volume: 117.40M, among the highest of the whole chart, with heavy volume on both up and down days. The Nov 5 spike and the following selloff came on large volume, which signals a volatile, contested market. Heavy volume on the retracement points to distribution into the spike. [Elevated, two-sided, slightly bearish]
DIVERGENCES & TRENDS
- Long-term trend: Price is at $50.78 versus the SMA200D at $135.95, about 63% below it. The 50-day SMA is also far below the 200-day, and a death cross happened long ago. The 200-day is still falling steeply, which fits the persistent decay of a leveraged inverse ETF, and it is no near-term resistance.
- Short-term trend: Price spiked from $41.68 to $81.22 in six sessions, then gave back about 37% of it, to $45.32 on Nov 11. It has since bounced to $50.78. Rallies have been sharp but short-lived.
- MACD: The bearish crossover on Nov 11 followed a peak at 6.96. The histogram turned negative and the MACD line is falling. There is no bullish crossover yet.
- Directional indicators: The ADX peak of 30.3 and the compression of +DI/−DI show the Nov 5 impulse is exhausting. A −DI crossover above +DI is possible if price loses $45.
- Price versus VWAP: Price is below VWAP ($57.38) and has been below it for the whole recent window, so VWAP is overhead resistance.
- Divergence: There is no clean RSI/price divergence. CMF and RSI are both fading from the Nov 5 highs along with price.
CHART PATTERNS
- Long-term bearish continuation: The collapse from about $495 to under $30 is a very large downtrend. The Jul–Oct sideways base at $28–$45 was broken only by a spike, and the spike failed to hold.
- Bearish expanding triangle (loose match): The recent swings show a higher high ($81) and alternating lows ($39.78, then $45.32), a widening range. That resembles the reference diagram's expanding triangle, a reversal-type pattern with a bearish bias after a rally. It is not fully confirmed. A break below roughly $39.78 would confirm it, with a measured move toward the $32–$33 area (lower Bollinger Band).
- Failed breakout: The Nov 5 spike to $81 was sold into immediately, which is a classic blow-off or failed breakout.
- Support zone: $44–$49 (SMA50 and EMA55) is the key support cluster.
POTENTIAL SCENARIOS
- Scenario 1: Bearish Fade of the Spike — The Nov 5 rally was a short-lived spike, and the structural decay of a 3x inverse ETF takes over. MACD stays below signal, +DI/−DI converge and cross, and price rolls over from the EMA21/VWAP resistance zone. Trigger: close below $49 (EMA55), then below $43.96 (SMA50). Target: $42–$46, with an extension toward $33–$35. Invalidation: daily close above $57.38 (VWAP) with MACD recrossing above signal. (50% probability)
- Scenario 2: Bullish Renewed Volatility Spike — Another selloff in semiconductors (the underlying index) sends SOXS back up, repeating the Nov 5 pattern. A rise above the EMA21 and VWAP would target the upper Bollinger Band. Trigger: close above $57.38 on strong volume with CMF above +0.05. Target: $65–$72. Invalidation: close below $43.96. (30% probability)
- Scenario 3: Neutral Choppy Range — Price whipsaws around the EMAs between $44 and $57 as ADX fades below 25. Trigger: ADX falling under 22 with price holding between SMA50 and VWAP. Target: $48–$54. Invalidation: close outside the $43–$58 range. (20% probability)
PRICE TARGETS
- Target Price: $46.50 (48-day horizon, Jan 2, 2027)
- Expected Range: $42.50 to $51.50 (width $9.00, about 17.7% of current price, consistent with the 30–60 day guidance). Note that ATR is large (about 17% of price), so a move outside this range is plausible, especially to the upside.
- Key Levels: Support at $43.96 (SMA50), Resistance at $57.38 (VWAP). The EMA21 at $51.14 is first resistance.
OVERALL BIAS
OVERALL BIAS: BEARISH - Price is far below a falling SMA200D and below VWAP. MACD has crossed bearish, ADX and the DI spread are fading from the Nov 5 spike, and the structural decay of a leveraged inverse ETF favours a drift lower. Volatility is extreme, so the call carries only modest conviction.
This is educational analysis and not financial advice.