SOXS 83-day bearish forecast — Nov 15, 2026
- Bias: Bearish
- Timeframe: 83 days (made Nov 15, 2026, target date Feb 5, 2027)
- Price at analysis: $50.78
- Price target: $43.50
- Expected range: $36.00 – $52.00
- Result: Pending — graded after the close on Feb 5, 2027
Get a free AI analysis of SOXS today
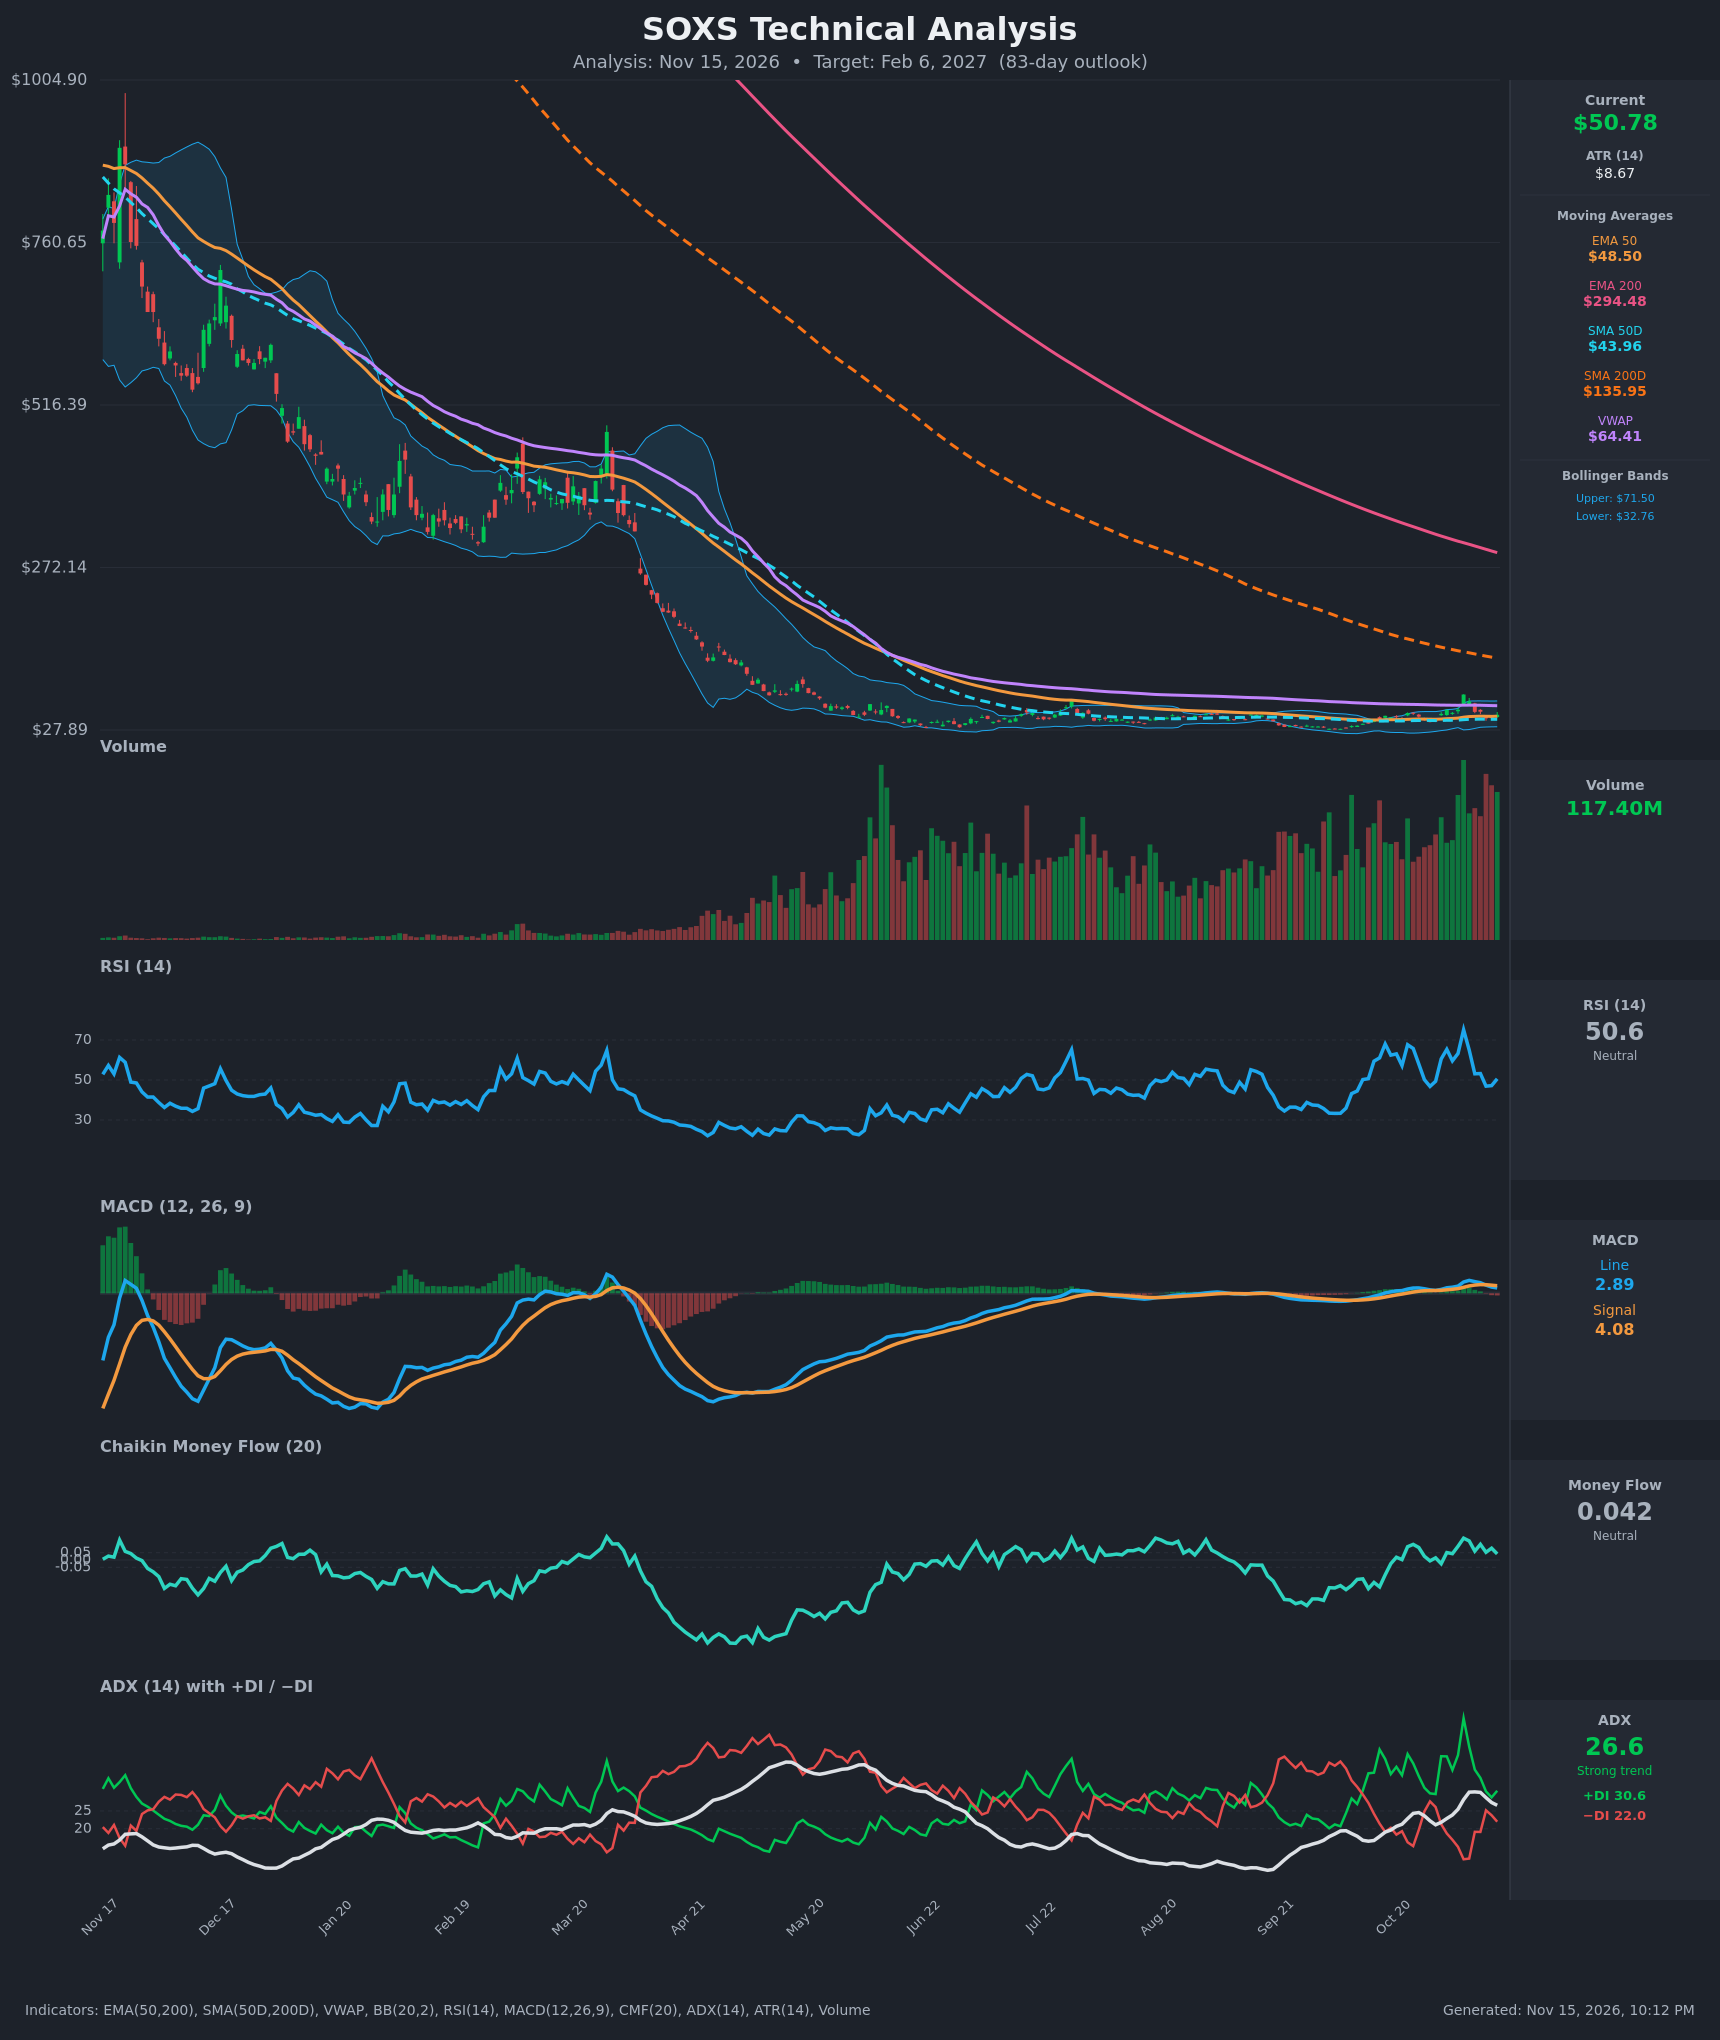
Analysis
TECHNICAL INDICATORS
- RSI (14): 50.59, dead neutral. It peaked near 75 on Nov 5 during the spike to $81 and has since rolled over to the 46-53 zone. Momentum is fading but not oversold. [Neutral]
- 20 EMA: No 20 EMA is supplied. Using the EMA 50 ($48.50) as the nearest dynamic average, price at $50.78 is only about 5% above it. The EMA 50 has been flat around $48 for a week, so it is thin support. Price remains far below the EMA 200 ($294.48), which is a long-term downtrend and distant resistance. [Neutral]
- MACD: Line 2.89 is below signal 4.08, so a bearish crossover occurred around Nov 11. The histogram is negative (about -1.2) and widening, down from the peak line of 6.96 on Nov 6. Momentum is rolling over from the spike. [Bearish]
- Bollinger Bands (20): Upper $71.50, lower $32.76, midline about $52.1. Price sits just below the midline. The bands are extremely wide because of the $81 spike, so the volatility regime is high. There is no squeeze and no band-walk, and price is drifting back toward the mean. [Neutral]
- CMF (20): 0.042, just under the +0.05 accumulation threshold. It has stayed mildly positive for months, with no meaningful distribution, but buying pressure is not strong either. [Neutral]
- ADX (14): 26.6 with +DI 30.6 above −DI 22.0. This is a moderate trend with bulls nominally on top. However, ADX has fallen from 30.3 and −DI has risen from 11 to 22, so the bullish thrust is weakening. [Moderate Trend, fading, +DI bias]
- Volume: 117.4M, and volume has trended higher through the whole base-building phase. The spike days (Oct 30, Nov 5) came on heavy volume and were sold into immediately. This shows two-way participation and no clean accumulation. [Neutral / Elevated Churn]
DIVERGENCES & TRENDS
- Long-term structure: Price is down roughly 95% over the chart window. It trades below the SMA 200D ($135.95), the EMA 200 ($294.48) and VWAP ($64.41). The SMA 50D ($43.96) is well below the SMA 200D, so a death cross is long established. The 3x inverse structure also adds persistent volatility decay.
- Moving-average position: Price is above the EMA 50 and SMA 50D, so the short-term trend has stabilized, but both are flat and converging with price.
- Spike failure: The surge to $81.22 on Nov 5 was fully retraced within about 4 sessions (to $45.32). RSI peaked near 75 and MACD peaked at 6.96, and both are now falling. This is a failed breakout, which is bearish.
- MACD vs price: The bearish MACD crossover came with price back near $45-51. This is a momentum loss rather than a classic divergence.
- Directional movement: −DI has climbed from 11.4 to 22.0 while +DI dropped from 51 to 30.6. A bearish DI crossover is plausible soon.
- Base-building: The price has based in the $28-50 area for months with rising volume. This is the main bullish counterpoint, since lows have lifted slightly (about $39.78 recently).
CHART PATTERNS
- Dominant pattern: A massive multi-month descending trend (the Bearish Rising Wedge / continuation family) has reached a low, volatile base. Within that base the price action is broadening, with a higher high at $81 and higher lows near $40. That loosely resembles a Bullish Expanding Triangle, but it is unconfirmed and erratic.
- Failed spike: The Nov 5 spike looks like a failed breakout (a bull trap) rather than a confirmed reversal.
- Significance: There is no clean reversal pattern, and the expanding structure carries large two-way risk. A fall below about $39.78 would invalidate the higher-low structure and open a retest of the $32-33 lower band and the $28 base. A close above $58-65 (VWAP) would be needed to confirm a real reversal.
POTENTIAL SCENARIOS
- Scenario 1: Bearish Decay Grind Lower — The spike fails, MACD stays below signal, and the inverse-leverage decay drags price back below the SMA 50D. Trigger: close below $45.30 followed by a break of $43.96. Target: $43 to $36, with a possible test of the $32.76 lower band. Invalidation: daily close above $58.30. (50% probability)
- Scenario 2: Neutral Choppy Range — Price keeps whipsawing between the SMA 50D and the recent bounce highs while ATR stays elevated. Trigger: failure to break either $39.78 or $58. Target: $42 to $56. Invalidation: close beyond $36 or $62. (25% probability)
- Scenario 3: Bullish Squeeze Higher — Another volatility spike (semiconductor sell-off) pushes price through VWAP. Trigger: close above $58.30 on rising volume with MACD re-crossing up. Target: $64.40 (VWAP), then $71.50 (upper band). Invalidation: close below $43.96. (25% probability)
PRICE TARGETS
- Target Price: $43.50 (83 days, Feb 6, 2027)
- Expected Range: $36.00 to $52.00 (width $16.00, about 31% of the current price, consistent with the 61-180 day guidance at the upper end because of the very high ATR)
- Key Levels: Support at $43.96 (SMA 50D), Resistance at $58.30
OVERALL BIAS
OVERALL BIAS: BEARISH - A bearish MACD crossover, a failed spike to $81 (RSI rolled over from 75), falling ADX with rising −DI, price below VWAP and both 200-period averages, and structural volatility decay in a 3x inverse ETF all favor a drift lower toward the SMA 50D area. A moderately positive CMF and the multi-month base limit conviction.
This is educational analysis and not financial advice.