SOXS 20-day bearish forecast — Nov 15, 2026
- Bias: Bearish
- Timeframe: 20 days (made Nov 15, 2026, target date Dec 4, 2026)
- Price at analysis: $50.78
- Price target: $47.50
- Expected range: $44.50 – $51.00
- Result: Pending — graded after the close on Dec 4, 2026
Get a free AI analysis of SOXS today
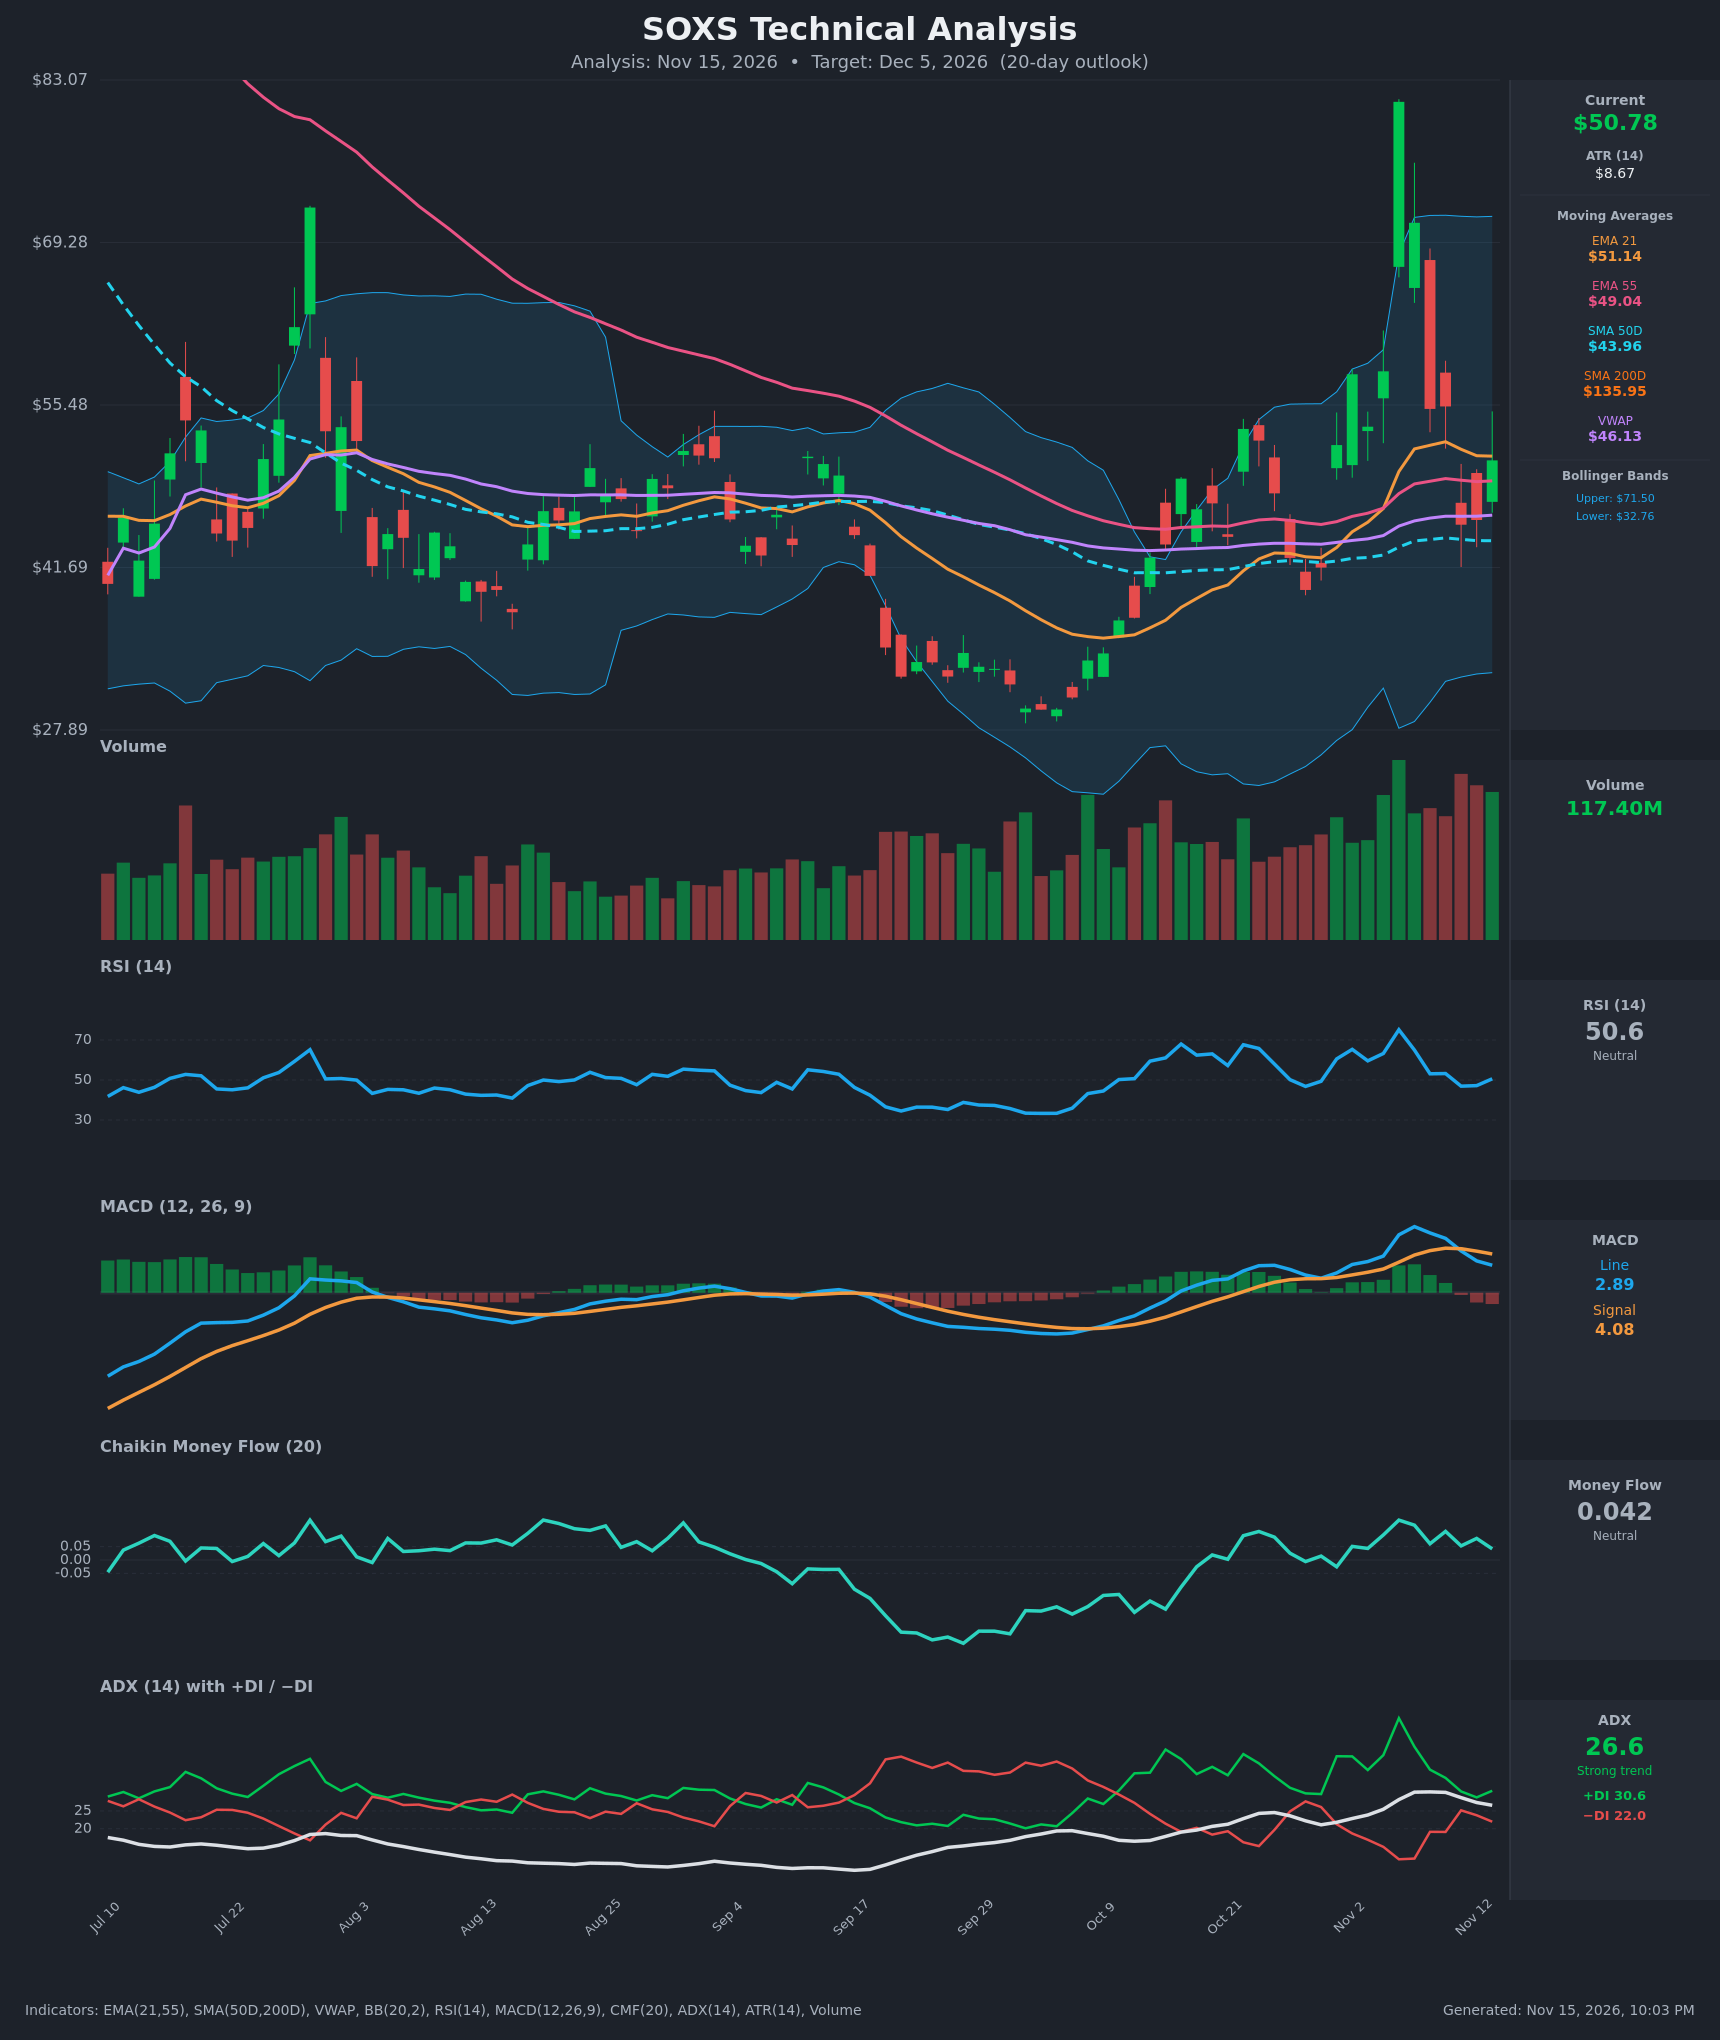
Analysis
TECHNICAL INDICATORS
- RSI (14): 50.59, dead neutral. It has fallen from a 75.1 spike on Nov 5 and is stabilizing in the high 40s to low 50s after a bounce from 46.9. Momentum is flat. [Neutral]
- 20 EMA: The EMA 21 is $51.14 and price at $50.78 sits just under it. The EMA 21 is rolling over after peaking near $52.36, so it is acting as immediate resistance. Price is still above the EMA 55 ($49.04) and the SMA 50D ($43.96). [Neutral]
- MACD: The line (2.89) is below the signal (4.08) after a bearish crossover on Nov 11, and the histogram is negative at about -1.19 and still expanding. The line has been falling for five sessions, while still positive. [Bearish]
- Bollinger Bands (20): Upper is $71.50, lower is $32.76, and the midline is about $52.1. The bands are very wide because of the Nov 5 spike to $81. Price is just below the midline and the bands are not signaling an extreme. The midline (~$52) is overhead resistance. [Neutral]
- CMF (20): 0.042, inside the neutral band (±0.05). It has been mildly positive but is fading from 0.149 on Nov 5, so buying pressure is weakening. [Neutral]
- ADX (14): 26.6 with +DI 30.6 above −DI 22.0. This is a trend-strength reading, but ADX has fallen from 30.3 and the DI spread has narrowed from 40.6 vs 14.9 on Nov 4. The bullish trend is losing steam. [Strong Trend, fading, +DI bias]
- Volume: 117.40M, elevated and among the heaviest of the period. The big volume came with the Nov 5 blow-off spike and its rapid reversal, which suggests a climactic spike followed by distribution. The latest bounce is on high volume but with an upper wick, so it is not clean confirmation. [Mixed / climactic]
DIVERGENCES & TRENDS
- MACD/price: Price bounced from $45.32 to $50.78 over the last two sessions while MACD kept falling and the histogram turned negative. This is a bearish momentum divergence and suggests the bounce is corrective.
- Moving averages: The EMA 21 is rolling over toward a possible bearish cross of the EMA 55 (a gap of just ~$2). Price is above the SMA 50D and VWAP ($46.13), which are the main bullish supports.
- SMA 200D: At $135.95 it is far above price, indicating a long-term downtrend. It is falling fast, so the level looks distorted (likely adjusted for splits), and I treat it as a long-term bearish backdrop only. A golden cross is not close.
- DI/ADX: +DI is still on top, but its spread over −DI is compressing and ADX is rolling over, so the trend is weakening.
- Structure: Higher lows since the late-September trough near $29 keep the intermediate trend constructive. The Nov 5 spike to $81 was fully retraced within four sessions, which is a classic blow-off pattern.
CHART PATTERNS
- Over the last two weeks the action resembles a Bearish Expanding Triangle / broadening structure, with wild swings between $39.78 and $81.22 and no clear contraction. It is a volatile, unstable formation with a bearish tilt, since price is failing at the declining EMA 21.
- The Nov 5 spike and full reversal is a blow-off top, a reversal-type signal. The measured downside is a retest of the pre-spike base near $45 and then the $42-43 zone (SMA 50D).
- The larger higher-low base since September could still be read as a Bullish Falling Wedge / Double Bottom breakout structure. It would be confirmed only by a close above ~$55-58.
POTENTIAL SCENARIOS
- Scenario 1: Bearish Rejection and Fade — Price fails at the EMA 21/Bollinger midline (~$51-52), the MACD histogram keeps expanding negative, and the blow-off spike is followed by a retest of the base. Trigger: close below $49.04 (EMA 55). Target: $45.30 first, then $43-44 (SMA 50D). Invalidation: daily close above $55.40. (50% probability)
- Scenario 2: Bullish Trend Resumption — The higher-low structure holds, +DI stays dominant, and price breaks above the EMA 21 and the Bollinger midline. Trigger: close above $55.40 on strong volume. Target: $60-63, with a stretch toward $65. Invalidation: close below $45.30. (35% probability)
- Scenario 3: Neutral Range Chop — Price oscillates between the EMA 55 and the EMA 21/midline while MACD resets toward zero. Trigger: closes between $46 and $54. Target: $49-52. Invalidation: close outside $45 or $55.40. (15% probability)
PRICE TARGETS
- Target Price: $47.50 (20-day, about -6.5% from $50.78)
- Expected Range: $44.50 to $51.00 (width $6.50, ~12.8% of current price). This is at the top of the 14-21 day guidance of 8-12%, given the high volatility (ATR of $8.67).
- Key Levels: Support at $45.30, Resistance at $55.40. The EMA 55 near $49.04 is minor support, and the EMA 21 near $51.14 is minor resistance.
OVERALL BIAS
OVERALL BIAS: BEARISH - The MACD bearish crossover with an expanding negative histogram, a fading ADX, price stalling at the EMA 21/Bollinger midline, and the fully retraced blow-off spike all favor a pullback toward the $45 base. The higher-low structure and the +DI lead keep conviction modest.
This is educational analysis and not financial advice.