SOXS 4-day bearish forecast — Nov 1, 2026
- Bias: Bearish
- Timeframe: 4 days (made Nov 1, 2026, target date Nov 4, 2026)
- Price at analysis: $52.05
- Price target: $50.80
- Expected range: $49.20 – $53.00
- Result: Incorrect (+12.1%) — closed at $58.34 on Nov 4, 2026; quality score 0/100
Get a free AI analysis of SOXS today
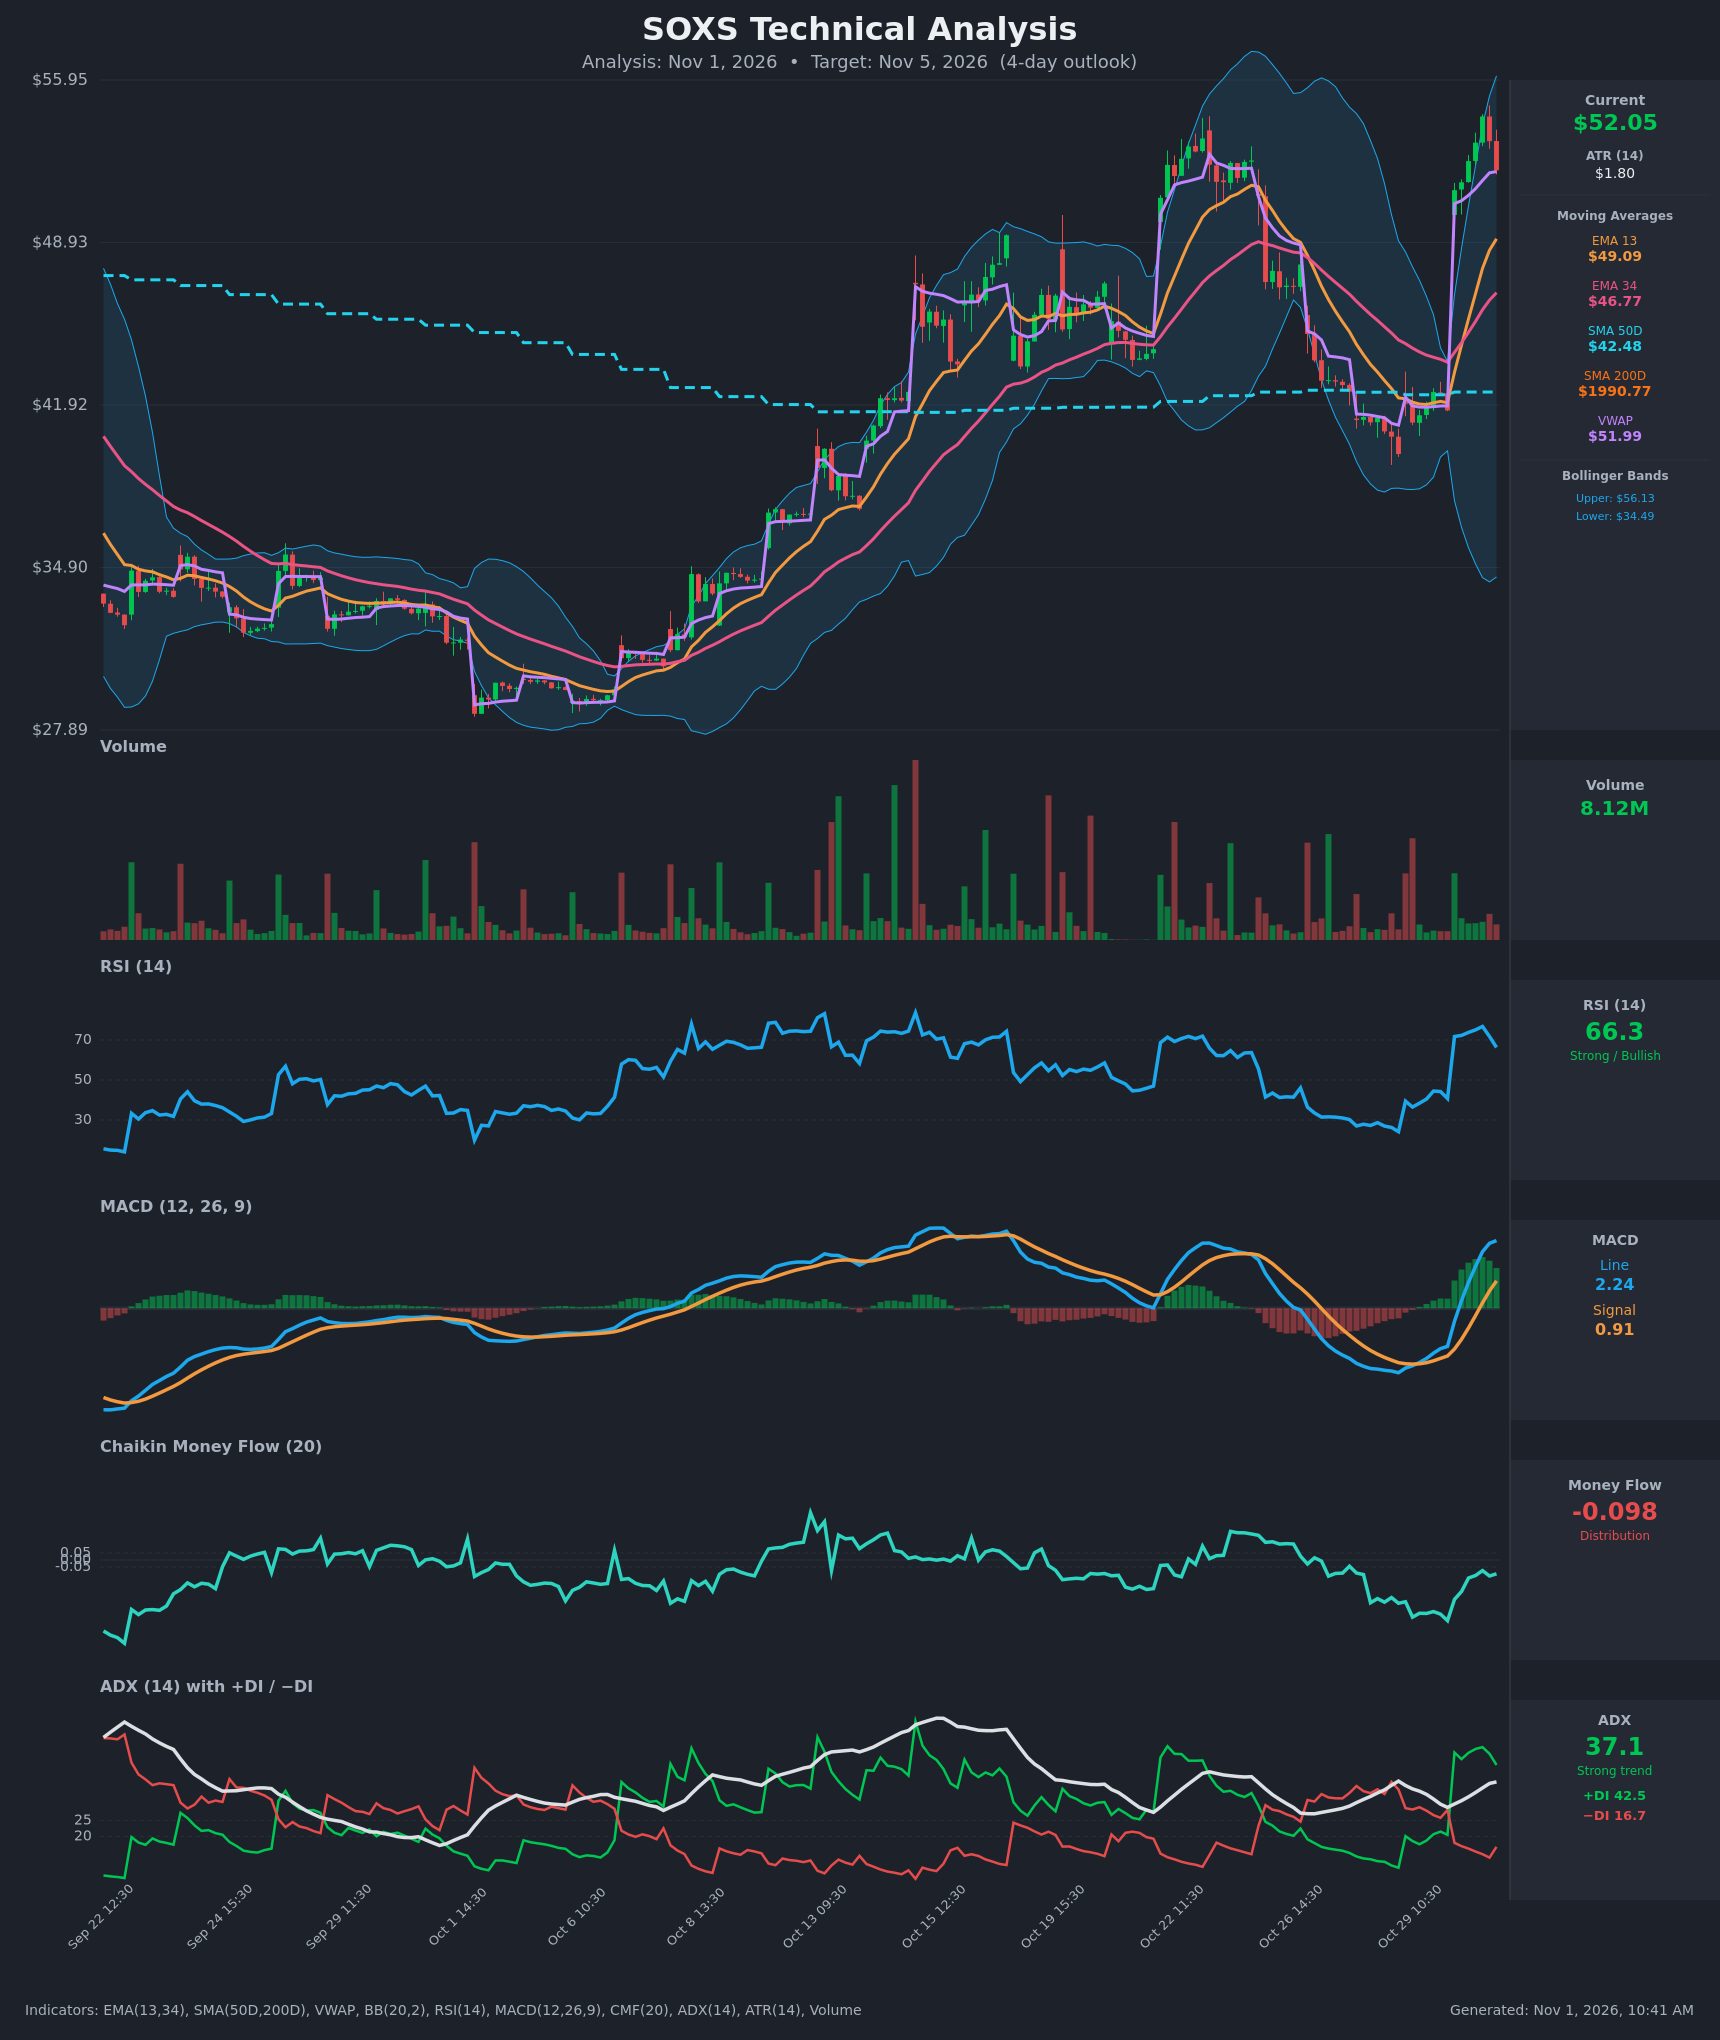
Analysis
TECHNICAL INDICATORS
- RSI (14): 66.28, down from a peak of 76.8 at the $54.37 high. It has dropped about 10 points in two bars, which shows near-term momentum fading from overbought. It is still above 50. [Neutral]
- 20 EMA: The data gives EMA 13 at $49.09 and EMA 34 at $46.77. Price at $52.05 is above both, and EMA 13 crossed above EMA 34 on Oct 30 at 11:30. Price is about 6% above EMA 13, which is stretched and invites a pullback toward it. [Bullish]
- MACD: The line at 2.24 is above the signal at 0.91, and both are positive after a fresh bullish crossover on Oct 30. The histogram is positive and still expanding, though the line's rate of rise is slowing (2.149 to 2.240). [Bullish]
- Bollinger Bands (20): Upper $56.13 and lower $34.49, so the bands are very wide after the gap. Price is in the upper third of the bands and has come off the high. The wide bands mean a violent volatility expansion, and price tends to mean-revert toward the midline (about $45) after such spikes. [Neutral]
- CMF (20): -0.098 is below -0.05, which means distribution. Price rose sharply while money flow stayed negative, so buying pressure is not confirming the rally. [Distribution]
- ADX (14): 37.1 and rising, with +DI at 42.5 well above −DI at 16.7. This is a strong uptrend, though +DI has started to roll over from 48.1. [Strong Trend + Bullish]
- Volume: 8.12M is modest compared with the earlier spikes. The gap bar and the rally lacked heavy volume, and the latest candles are red. The rally looks like a gap-driven move with limited sustained participation. [Neutral to mildly Bearish]
- VWAP / SMAs: Price is $52.05 versus VWAP $51.99, so it is sitting right on VWAP after the pullback. VWAP is the pivot, and a close below it would favor sellers. The SMA200D reading ($1,990.77) is clearly a data artifact, probably from unadjusted reverse splits, so I am ignoring it and the "golden/death cross" signal it implies. SMA50D is $42.48, well below price. [Neutral]
DIVERGENCES & TRENDS
- CMF divergence: Price made a sharp higher high while CMF stayed negative around -0.10. This is a bearish money-flow divergence.
- RSI: It peaked at 76.8 with the price high, so there is no classic divergence. It is now turning down from overbought.
- Crossovers: EMA 13 crossed above EMA 34, MACD crossed above its signal, and +DI crossed above −DI. These are all bullish, but they came from a single one-day gap of about 23% (from $41.69 to $51.19), so they are lagging and exaggerated.
- Trend: Price has made three consecutive lower closes ($54.37, $53.30, $52.05) after the high. Short-term momentum is turning down inside a larger uptrend.
- Gap risk: The gap from about $41.7 to $51.2 left a large unfilled void. Price is far above EMA 13, so a pullback toward $49–50 is plausible.
CHART PATTERNS
- Gap-and-run / early Bullish Flag or Pennant: A near-vertical move from $41.7 to $54.4 is followed by a shallow, downward-sloping pullback. It resembles a Bullish Flag, but only 2–3 bars have formed, so it is unconfirmed. A flag target would be a measured move of about $12–13 above a breakout over $54.4, which is not relevant within 4 days.
- Prior base: The chart shows a large base and recovery from about $28 (a multi-month V-shaped recovery). Previous peaks near $52–53 on Oct 22 are now a resistance and support zone.
- Rejection: The failure at the upper Bollinger Band area near $56 and the failure to hold $54 resemble a short-term Bearish Double Top setup against the Oct 22 high around $52–53. This is speculative.
POTENTIAL SCENARIOS
- Scenario 1: Bearish Pullback to EMA 13 — Overbought RSI rolling over, negative CMF, and a gap far above the moving averages favor a retracement. Trigger: a hourly close below VWAP/$51.99 and $51.00. Target: $50.80, with an extension to $49.10 (EMA 13). Invalidation: a close above $54.40. (50% probability)
- Scenario 2: Bullish Trend Continuation — ADX is strong, +DI dominates, and MACD is expanding, so dip buyers defend VWAP and price retests the highs. Trigger: a bounce off $51.5–52 and a break above $54.37. Target: $55.50–56.10 (upper Bollinger Band). Invalidation: a close below $50.00. (35% probability)
- Scenario 3: Neutral Consolidation — Price digests the gap in a $50.5–$53.5 range around VWAP. Trigger: tight, low-volume candles around $52. Target: about $52. Invalidation: a break outside $50.0–$54.4. (15% probability)
PRICE TARGETS
- Target Price: $50.80 (4-day horizon)
- Expected Range: $49.20 to $53.00 (width $3.80, about 7.3% of the current price, which fits the guidance for a 4-day horizon)
- Key Levels: Support at $49.09 (EMA 13), Resistance at $54.37 (recent high)
OVERALL BIAS
OVERALL BIAS: BEARISH - Price is stretched about 6% above EMA 13 after a one-day gap. RSI is rolling over from overbought, CMF shows distribution, and three consecutive lower closes point to a pullback toward $49–51, even though the larger trend (ADX 37, MACD positive) remains up.
This is educational analysis and not financial advice.