NBIS 6-day bearish forecast — Nov 1, 2026
- Bias: Bearish
- Timeframe: 6 days (made Nov 1, 2026, target date Nov 6, 2026)
- Price at analysis: $154.10
- Price target: $150.50
- Expected range: $143.50 – $159.50
- Result: Correct (-15.2%) — closed at $130.68 on Nov 6, 2026; quality score 50/100
Get a free AI analysis of NBIS today
Analysis
TECHNICAL INDICATORS
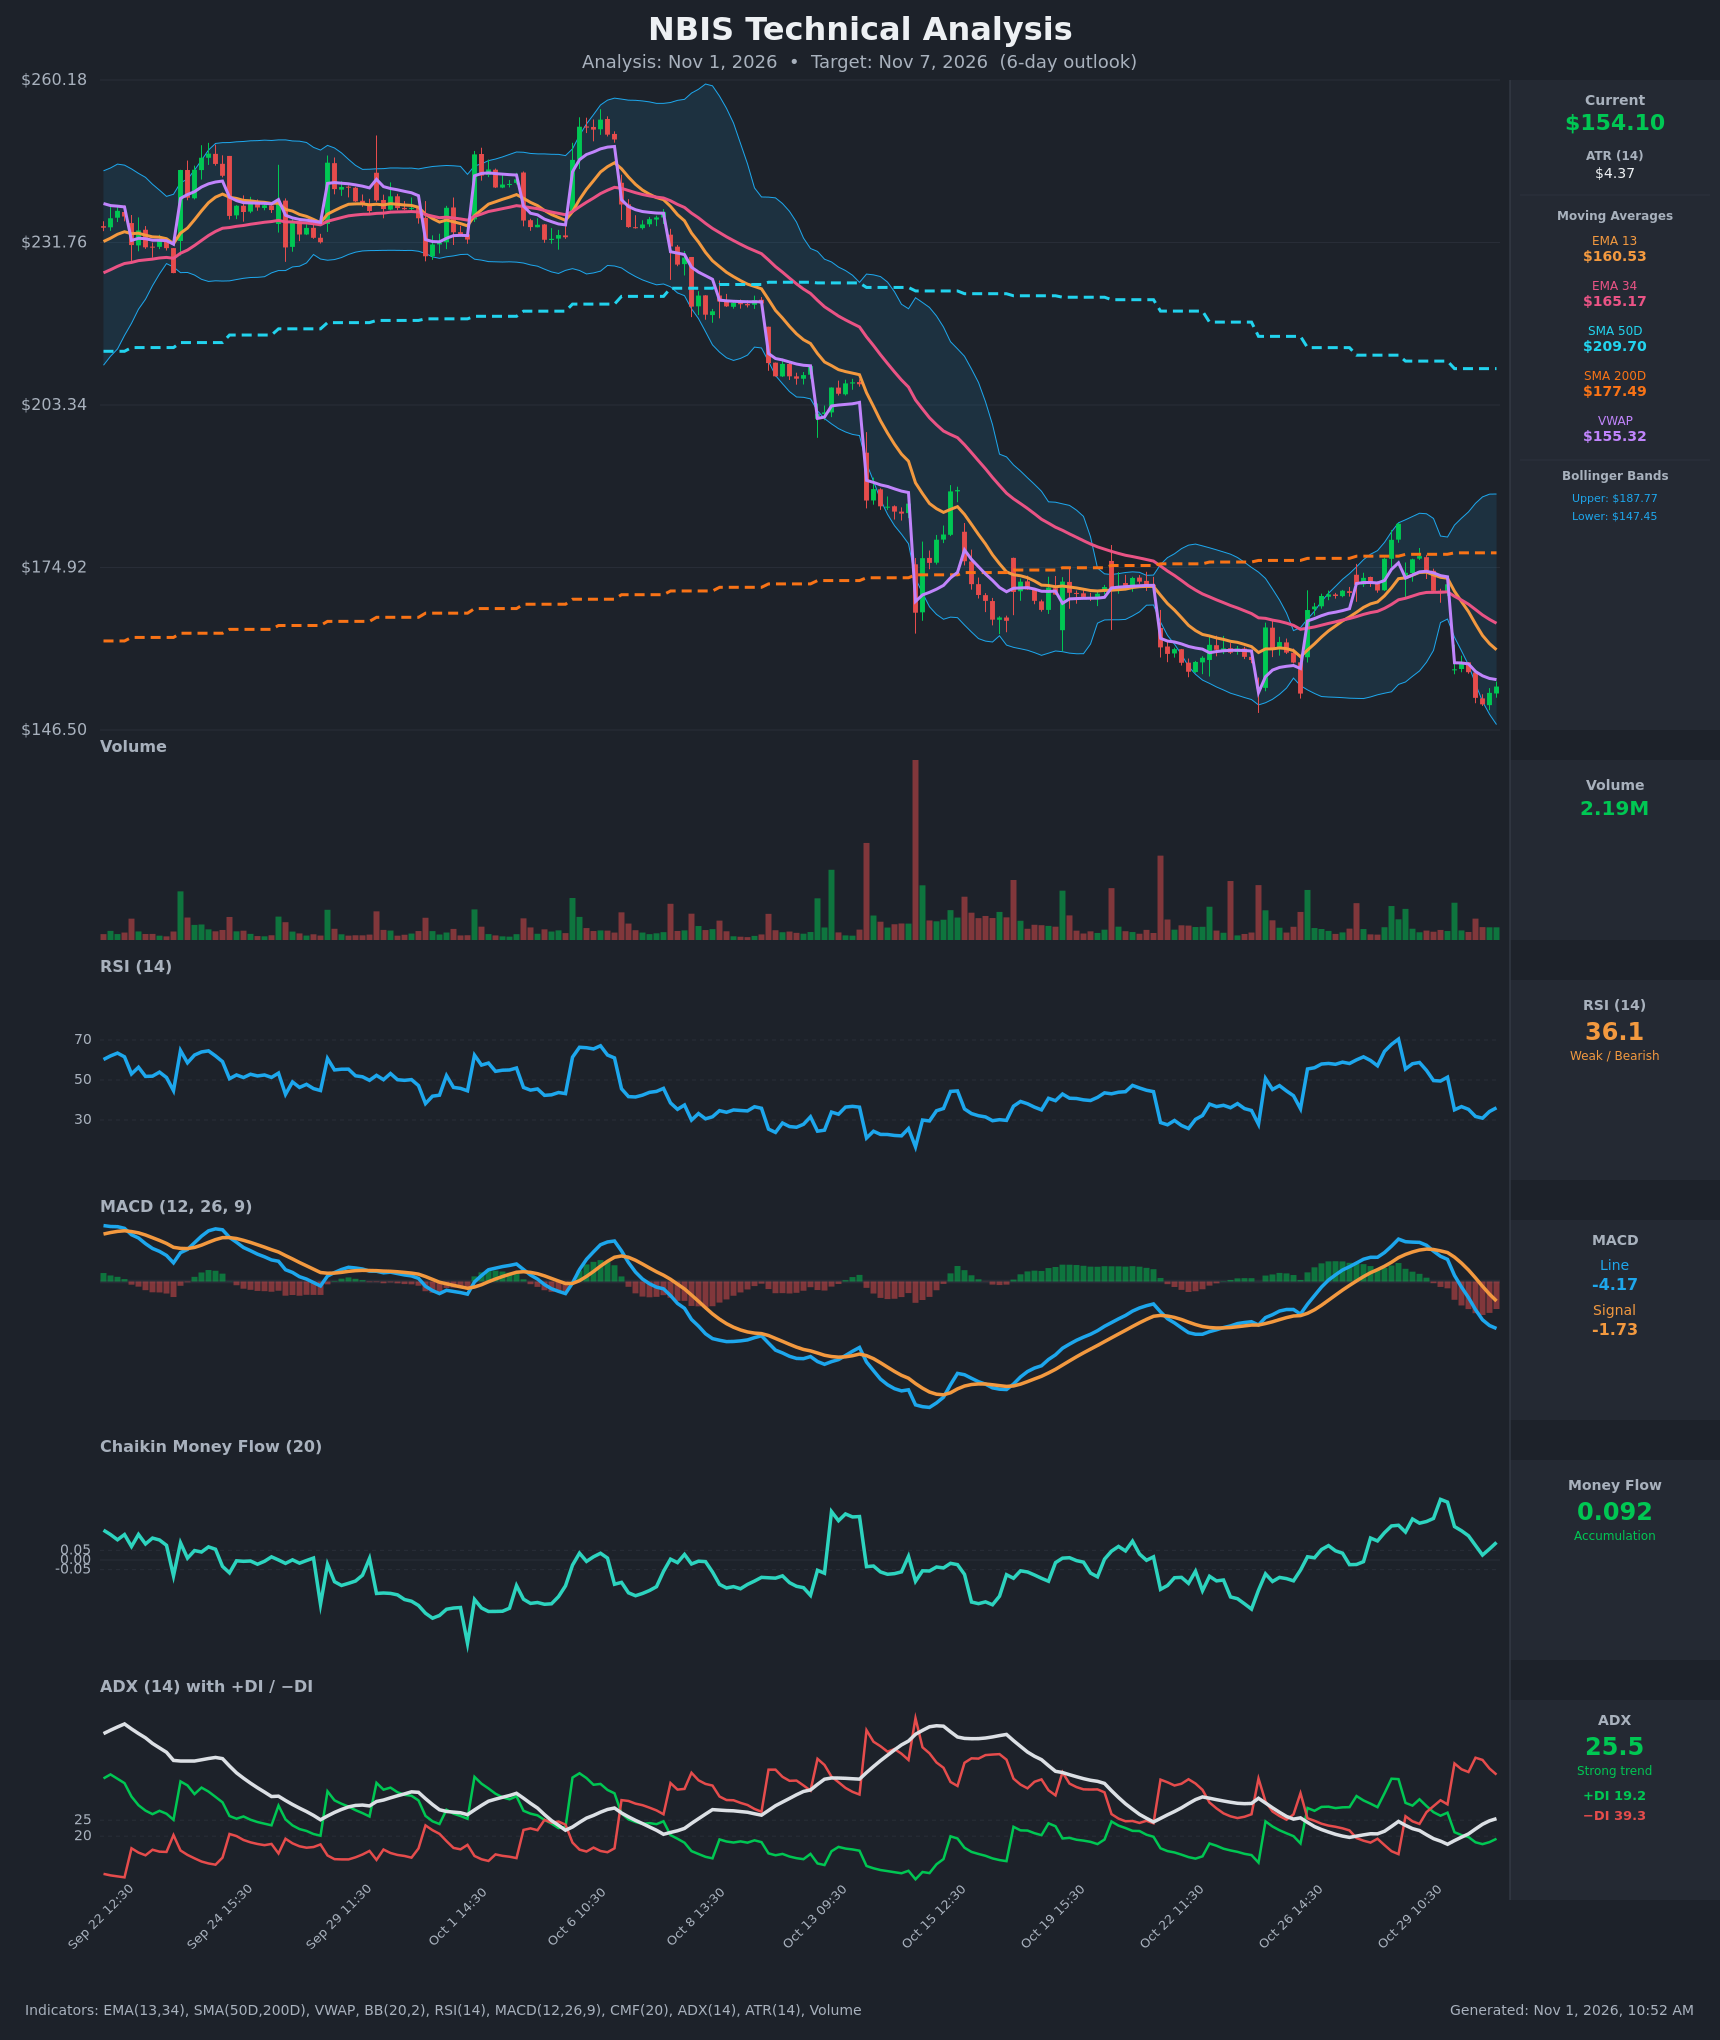
- RSI (14): 36.1, rising slightly from the 30.9 low but still weak and below 50. It dropped from 70 on Oct 28 to the low 30s in three sessions. Momentum is bearish, though it is approaching oversold. [Bearish]
- EMA (13/34): EMA13 is $160.53 and EMA34 is $165.17. Price at $154.10 is below both, and EMA13 is below EMA34 and falling fast. Both act as overhead resistance. [Bearish]
- MACD: The line is -4.17 and the signal is -1.73. The bearish crossover happened around Oct 30 13:30 and the gap is widening, with a negative, expanding histogram. [Bearish]
- Bollinger Bands (20): Upper is $187.77 and lower is $147.45, so price at $154.10 sits in the lower quarter of the bands. The bands are wide after the prior swing, and price tagged the lower band in the Oct 30 sell-off. This shows a stretched downside, but it is not a reversal signal by itself. [Bearish]
- CMF (20): 0.092, positive and above +0.05, though it is down from 0.316 on Oct 29 at 14:30. Buying pressure persists on a volume-weighted basis even as price falls, which is a mild positive divergence. [Accumulation]
- ADX (14): 25.5 and rising, with −DI at 39.3 above +DI at 19.2. The spread is wide, so the downtrend is strong and gaining strength. [Strong Trend – Bearish]
- Volume: 2.19M on the latest bar, which is average and not climactic. The Oct 30 gap-down came with no clear capitulation volume spike. [Neutral to mildly bearish]
- VWAP / SMAs: VWAP is $155.32, so price is just below it. Price is below SMA200D ($177.49) and SMA50D ($209.70), and SMA50D is well above SMA200D, so the long-term structure is damaged. EMA13 is below EMA34, and the 50D is rolling over. [Bearish]
DIVERGENCES & TRENDS
- Price made a lower low (~$151 on Oct 30), but RSI (30.9 low) is not at an extreme, and CMF stays positive. This is a mild bullish divergence, but it is not confirmed by MACD or the DI lines.
- MACD has crossed bearishly, and the histogram is expanding negative. The DI spread (−DI 39 vs +DI 19) is the widest since the early October decline.
- The sequence of lower highs and lower lows continues. The Oct 30 gap down from ~$172 to ~$157 broke below the 200-day average and the prior consolidation near $170.
- ADX is turning up from ~17 to 25.5, confirming a new bearish trend leg.
- Price is below VWAP and all moving averages. The EMA13/34 bearish crossover occurred on Oct 30 at about 10:30.
CHART PATTERNS
- Bearish Rising Wedge / bearish continuation: The Oct 22 to Oct 28 rally was a weak rising channel that broke down with a gap on Oct 30. This is a bearish reversal of that bounce, with a measured move implying a retracement toward the base of the wedge (~$150 or below).
- Prior downtrend: The broad decline from ~$250 to ~$150 shows a persistent lower-high structure. The Oct 28 spike to $182 was a failed bounce into the declining 200-day average.
- No confirmed bullish reversal pattern (double bottom, falling wedge) yet. Price is testing support at $147–$151 (lower Bollinger band and Oct 22–26 lows).
- Oversold bounces toward EMA13 ($160.5) and VWAP ($155.3) are likely to be sold into.
POTENTIAL SCENARIOS
- Scenario 1: Bearish Trend Continuation — Price fails at VWAP and EMA13 and breaks the $147–$151 support zone as −DI dominance and the MACD gap keep momentum negative. Trigger: close below $150.50 on rising volume. Target: $144–$146. Invalidation: sustained close above $161 (EMA13). (50% probability)
- Scenario 2: Bullish Oversold Bounce — Positive CMF and an RSI near oversold spark a relief rally into EMA13/EMA34 resistance. Trigger: reclaim of VWAP $155.32 and close above $158. Target: $160–$165. Invalidation: close below $149. (32% probability)
- Scenario 3: Neutral Range Chop — Price consolidates above the lower band without a catalyst. Trigger: holds $149–$158. Target: $153–$156. Invalidation: break of either boundary. (18% probability)
PRICE TARGETS
- Target Price: $150.50 (6-day)
- Expected Range: $143.50 to $159.50 (width $16.00, about 10.4% of current price, consistent with a 6-day horizon)
- Key Levels: Support at $147.45 (lower Bollinger band), Resistance at $160.53 (EMA13)
OVERALL BIAS
OVERALL BIAS: BEARISH - Price is below all key moving averages with a fresh bearish MACD crossover, −DI far above +DI, and ADX rising above 25, all of which favor continued downside. Positive CMF and a near-oversold RSI argue for a bounce, but the bounce likely meets resistance at VWAP and EMA13.
This is educational analysis and not financial advice.