NBIS 83-day bearish forecast — Nov 15, 2026
- Bias: Bearish
- Timeframe: 83 days (made Nov 15, 2026, target date Feb 5, 2027)
- Price at analysis: $115.88
- Price target: $105.00
- Expected range: $91.00 – $122.00
- Result: Pending — graded after the close on Feb 5, 2027
Get a free AI analysis of NBIS today
Analysis
TECHNICAL INDICATORS
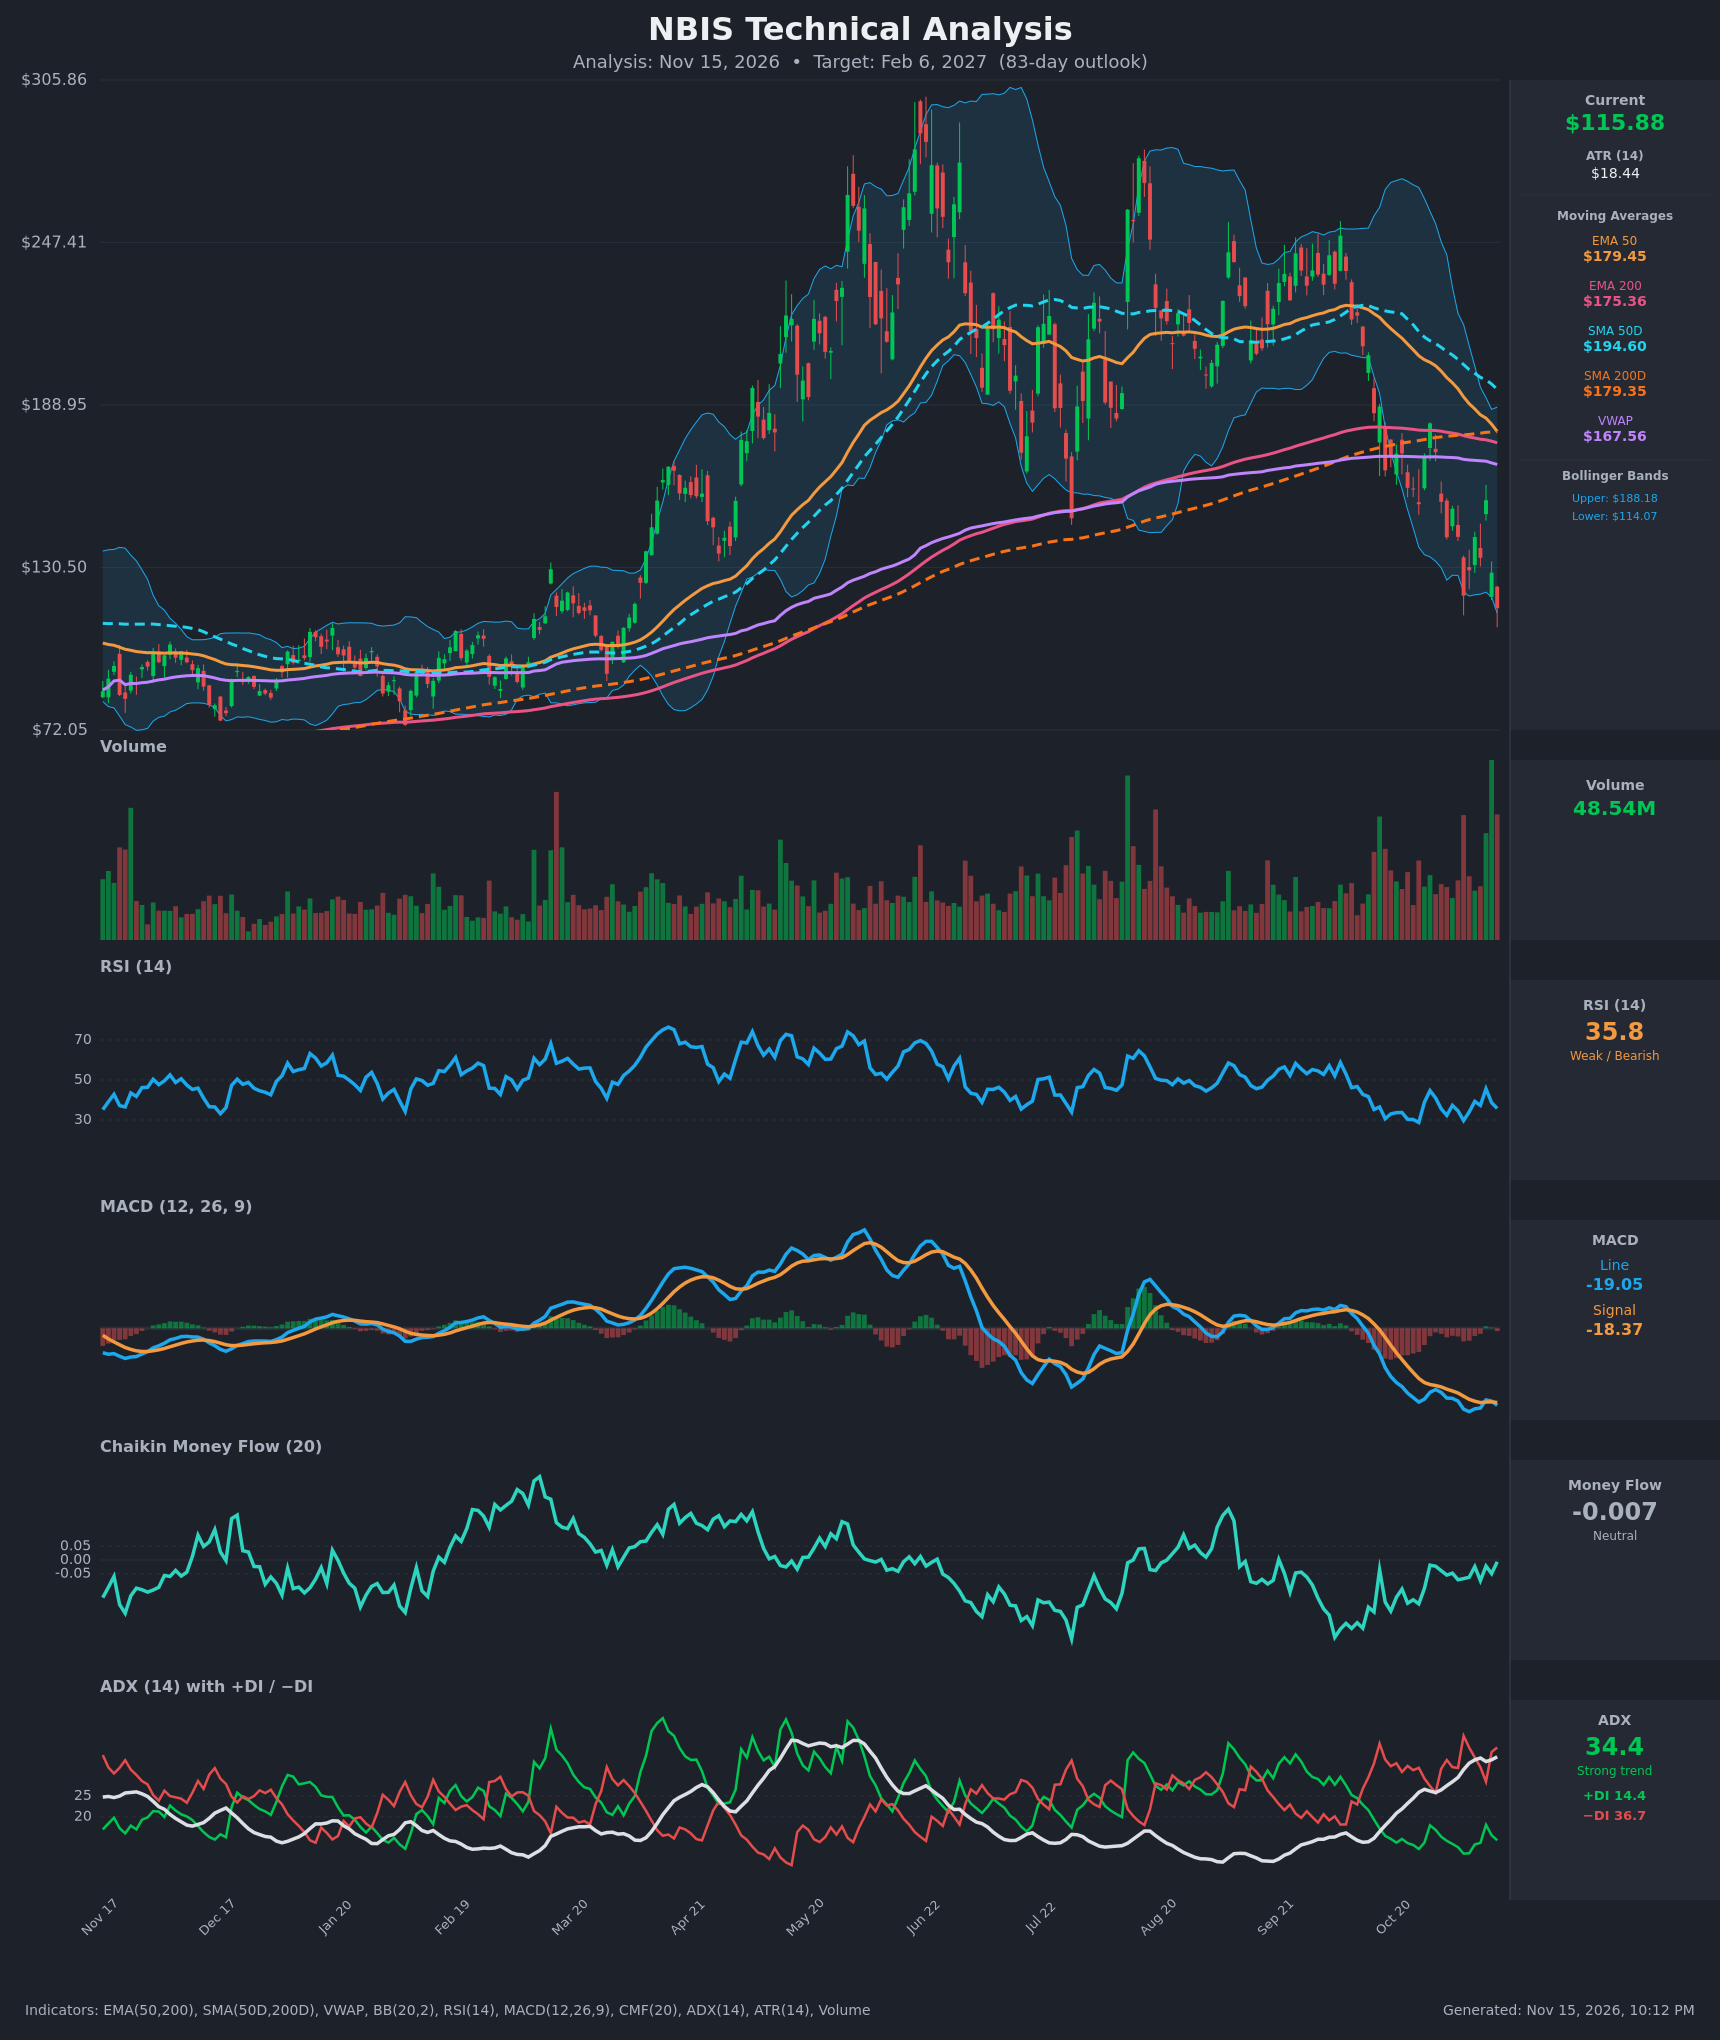
- RSI (14): 35.79, down from 45.6 on Nov 11 and close to the 30 oversold line but not yet there. RSI has stayed in the 29-39 band for most of the past two weeks, which is typical of a persistent downtrend. [Bearish]
- 20 EMA: Not supplied. The EMA 50 at $179.45 and EMA 200 at $175.36 are both far above the $115.88 price (about 35% above), so the moving averages act as heavy overhead resistance. EMA 50 has fallen from $206.65 to $179.45 in 15 bars and is closing in on EMA 200, so a bearish EMA death cross is imminent. [Bearish]
- MACD: Line -19.05 is below Signal -18.37, a histogram of about -0.68. The line briefly crossed above the signal on Nov 11, then rolled back under it on Nov 12. Both lines are deeply negative and near their lows, which suggests bearish momentum that has not yet turned. [Bearish]
- Bollinger Bands (20): Price at $115.88 sits just above the lower band ($114.07), with the upper band at $188.18. The bands are wide, with a bandwidth of about 64%. Price is "walking the band" lower, which is a trend-continuation signal, though it also leaves room for a snap-back toward the mid-band. [Bearish]
- CMF (20): -0.007, which is neutral (between -0.05 and +0.05). It has improved from -0.16 on Oct 26, so selling pressure has eased even as price kept falling. [Neutral]
- ADX (14): 34.4 and rising (25.9 to 34.4 over 15 bars), with −DI at 36.7 far above +DI at 14.4. This is a strong, established downtrend with bears in full control. [Strong Trend – Bearish]
- Volume: 48.54M, one of the highest readings on the chart. The latest bar is a large red candle, which reads as capitulation-style selling but also confirms the breakdown. Heavy volume on a break below the VWAP and SMA200 supports continuation. [Bearish with possible capitulation]
DIVERGENCES & TRENDS
- Price/RSI: Price made a new low at $115.88 (below the Nov 5 close of $120.37), but RSI at 35.8 is above the 29.7 it reached on Nov 5. This is a mild bullish divergence and the only real counter-signal on the chart.
- Price/CMF: CMF is rising from -0.16 toward zero while price makes lower lows, which is another mild divergence suggesting selling pressure is fading.
- MACD: Momentum has not confirmed a turn. The Nov 11 bullish crossover failed within a day, and the histogram is negative again.
- Moving averages: Price is below EMA 50, EMA 200, SMA 50D, SMA 200D and VWAP ($167.56), so the long-term trend is down. EMA 50 ($179.45) is only about $4 above EMA 200 and is falling at roughly $2 per bar, so a death cross should print within days. SMA 50D ($194.60) is converging on SMA 200D ($179.35) from $15 above. The gap was about $39 on Oct 26.
- ADX/DI: −DI crossed above +DI in mid-October and has stayed there. ADX is rising above 25, which confirms trend strength.
- Trend structure: Peaks of about $290 in June, $270 in August and $250 in October form a series of lower highs. The August low near $150 was broken in November.
CHART PATTERNS
- Bearish Triple Top / descending-peak structure (reversal): Three declining highs ($290, $270, $250) followed by a break of the $150 support zone and the 200-day average. The measured move from the pattern is much larger than the current drop, which points to a longer-term bearish bias. In practice, the prior base at $90-$105 is the realistic first target.
- Bearish Flag (continuation): The Nov 9-11 bounce ($141-$155) was a failed relief rally that rolled over into a new low at $115.88. This supports continuation lower.
- Reference-level note: The Feb-May consolidation zone at $90-$105 is the logical support shelf if the decline continues.
POTENTIAL SCENARIOS
- Scenario 1: Bearish Trend Continuation — The strong ADX/−DI trend persists, the EMA and SMA death crosses confirm, and price breaks the lower Bollinger Band and the Nov intraday low, drifting into the prior base. Trigger: daily close below $110 on heavy volume. Target: $95-$105, with an extreme test of $90. Invalidation: daily close above $141 (the Nov 9 close and the failed flag high). (50% probability)
- Scenario 2: Bullish Oversold Relief Rally — The RSI/CMF divergences and the stretched price relative to the mean trigger a rebound toward the VWAP/mid-band area. Trigger: MACD bullish crossover with a close above $129.50 and then $141. Target: $135-$150, with a possible stretch to $167 (VWAP) that would be sold into. Invalidation: close below $105. (32% probability)
- Scenario 3: Neutral Base Formation — Selling exhausts and price chops between roughly $100 and $130 for weeks as ADX fades. Trigger: ADX rolling over below 25 with ranges contracting. Target: $105-$125. Invalidation: close below $100 or above $141. (18% probability)
PRICE TARGETS
For the 83-day horizon (through about Feb 6, 2027), the range is scaled to roughly 27% of the current price, in line with the 61-180 day guidance. Range width is $122.00 − $91.00 = $31.00, or 26.8% of $115.88.
- Target Price: $105.00 (about 9% below current)
- Expected Range: $91.00 to $122.00
- Key Levels: Support at $110.00, Resistance at $129.50
OVERALL BIAS
OVERALL BIAS: BEARISH - Price is below every major moving average and VWAP, ADX of 34 with −DI at 36.7 versus +DI at 14.4 confirms a strong downtrend, MACD is negative and re-crossing lower, and an EMA death cross is imminent on heavy-volume breakdown. The RSI and CMF divergences argue for bounces along the way, but they do not yet signal a trend reversal.
This is educational analysis and not financial advice.