NBIS 48-day bearish forecast — Nov 15, 2026
- Bias: Bearish
- Timeframe: 48 days (made Nov 15, 2026, target date Jan 1, 2027)
- Price at analysis: $115.88
- Price target: $104.00
- Expected range: $88.00 – $128.00
- Result: Pending — graded after the close on Jan 1, 2027
Get a free AI analysis of NBIS today
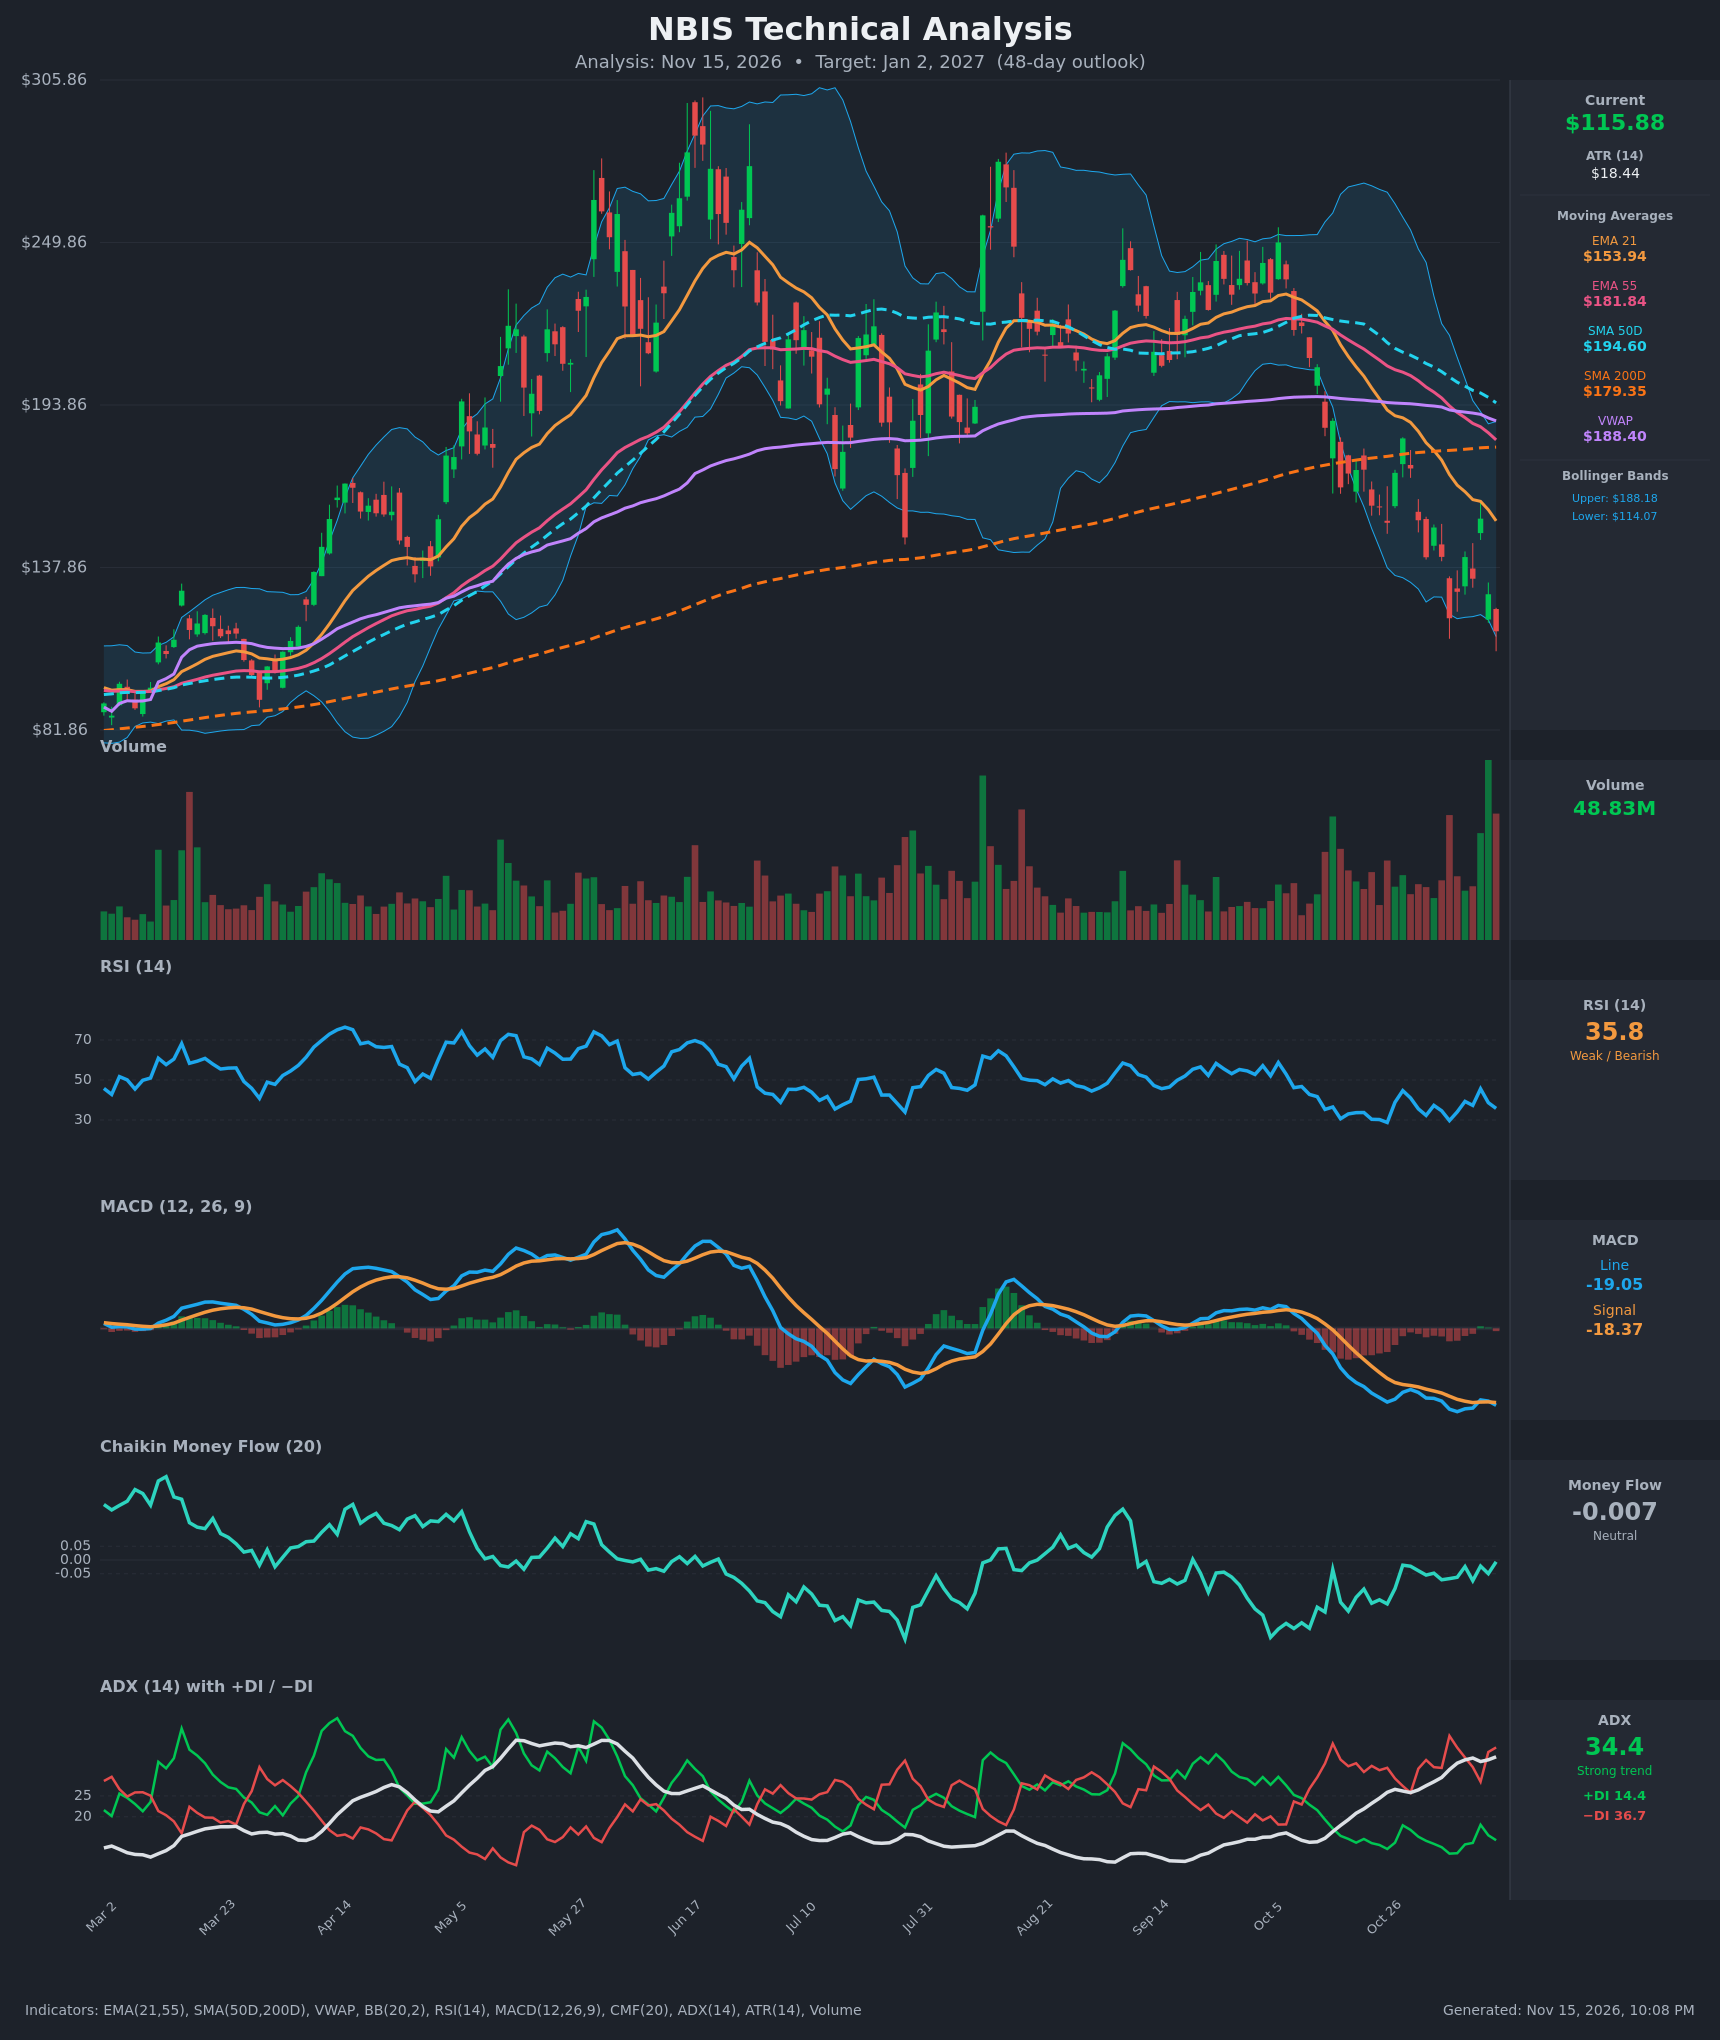
Analysis
TECHNICAL INDICATORS
- RSI (14): 35.79, below 50 and approaching oversold (<30). It touched 29.7 on Nov 5 and bounced only to 45.6 before rolling over. Lower highs in RSI show momentum remains weak, though the reading is not yet extreme. [Bearish]
- 20 EMA (EMA 21 = $153.94): Price at $115.88 is about 25% below the EMA 21, which is falling steeply and acts as overhead resistance. EMA 21 is also well below EMA 55 ($181.84), a bearish alignment that has persisted since the late-Oct breakdown. [Bearish]
- MACD: Line -19.05 is below signal -18.37, with a slightly negative histogram. Both lines sit deep below zero and have been trending lower. The line crossed back below the signal after a brief Nov 11 cross above, so bearish momentum persists, though the compression suggests the pace of the decline is slowing. [Bearish]
- Bollinger Bands (20): Upper $188.18, lower $114.07. Price at $115.88 is hugging the lower band (about 2.4% above it) after repeated touches. The bands are wide, which reflects high volatility. A band walk in a strong downtrend is bearish, though a mean-reversion bounce is possible. [Bearish]
- CMF (20): -0.007, in the neutral zone (between -0.05 and +0.05). It has recovered from -0.16 on Oct 26, so selling pressure has eased even as price kept falling. This is a mild positive divergence. [Neutral]
- ADX (14): 34.4 and rising, well above 25, which marks a strong trend. -DI (36.7) is far above +DI (14.4), so bears are firmly in control. [Strong Trend – Bearish]
- Volume: 48.83M on the latest bar, which is very high. The chart shows a volume spike on the final down candle and on the last several sessions. Heavy volume on a decline near the lows suggests either continued distribution or capitulation. The price is making new lows without a reversal bar, so capitulation is not yet confirmed. [Bearish / possible capitulation]
Other moving averages: price is far below SMA200D ($179.35), SMA50D ($194.60) and VWAP ($188.40). SMA50D is still above SMA200D, but the gap is narrowing quickly (about $15). A death cross is possible within weeks if the decline persists.
DIVERGENCES & TRENDS
- CMF vs price: Price has made lower lows (from $153 to $115.88), while CMF has recovered from -0.16 to roughly neutral. This is a mild bullish divergence, suggesting selling pressure is fading.
- RSI vs price: RSI made a low of 29.7 on Nov 5 at $120.37. Price is now lower at $115.88 with RSI at 35.8, a mild bullish RSI divergence. It is not confirmed, because RSI has not turned up.
- MACD: Line and signal are both deep negative and compressing, so downside momentum is stabilizing. A bullish cross is possible only if price bounces.
- Trend: Price fell from about $250 in early Oct to $116, a drop of more than 50%. It broke through SMA200D, EMA 55 and EMA 21 in sequence, and EMA 21 crossed below EMA 55 in late Oct. SMA50D is rolling over and heading toward SMA200D.
- ADX: Rising, with -DI dominant, so the trend is intensifying.
- Volatility: ATR of $18.44 (about 16% of price) means daily swings are very large, with several +/-10% days recently.
CHART PATTERNS
- Primary pattern: A broad Bearish Head and Shoulders / Double Top structure. Peaks near $295 (Jun) and $270 (Aug) were followed by a lower high near $250 (Oct). The neckline around the $137-$140 area (the mid-year lows) and then SMA200D at about $179 have both broken. This is a major reversal confirmation.
- Recent action: A choppy descending channel of lower highs ($182 → $154 → $154) and lower lows ($141 → $120 → $116). It resembles a bearish flag/falling channel that continues the downtrend.
- Support test: Price is at the base of the March-April range ($100-$115). That zone and the lower Bollinger Band offer possible support.
- Targets: The head-and-shoulders measured move (head ≈ $295 down to neckline ≈ $140, a ~$155 height) projects a target of roughly $0-$20 above zero. That is not realistic in 48 days, so intermediate support at about $100 and then $82-$90 (the March lows) is the more practical downside area.
POTENTIAL SCENARIOS
- Scenario 1: Bearish Continuation Lower — The strong trend (ADX 34, -DI 37 vs +DI 14), the death-cross risk and the position below every moving average keep sellers in control. Rallies fail at the EMA 21 area. Trigger: daily close below $110-$114 (lower Bollinger Band and recent low). Target: $95-$100, with an extension to $85-$90. Invalidation: daily close above $135 with rising volume. (50% probability)
- Scenario 2: Neutral/Bullish Oversold Bounce, Then Range — Capitulation volume, RSI and CMF divergences and a touch of the lower band spark a relief rally toward the falling EMA 21, then price stalls under resistance. Trigger: hold above $108-$110 with a bullish MACD cross. Target: $130-$145. Invalidation: close below $105. (30% probability)
- Scenario 3: Bullish Trend Reversal — Strong capitulation low, then a sharp recovery reclaiming the EMA 21 and heading toward SMA200D. Trigger: close above $155 (EMA 21 and the Nov 11 high). Target: $170-$180. Invalidation: rejection below $140 and a new low. (20% probability)
PRICE TARGETS
For the 48-day timeframe (to ~Jan 2, 2027), the range width should be about 12-18% of price, which is roughly $14-$21 for a normal stock. NBIS has very high volatility (ATR $18.44, ~16% of price), so I widen the range to about 30%, using a higher-volatility adjustment. Range width: $135.00 - $90.00 = $45.00, or 38.8% of $115.88. That is wider than the standard guide, so I tighten it slightly: $88.00 to $128.00 gives $40 width, or 34.5%, which is still deliberately wide to reflect volatility of this magnitude, and well beyond what a 14-day range would need.
- Target Price: $104.00 (below current price, consistent with the bearish trend but allowing for oversold bounces)
- Expected Range: $88.00 to $128.00
- Key Levels: Support at $100.00 (psychological level and the March-April consolidation zone; the lower Bollinger Band at $114.07 is the first line and is already being tested), Resistance at $135.00 (the Nov 10 area and prior breakdown zone, ahead of the EMA 21 at $153.94)
OVERALL BIAS
OVERALL BIAS: BEARISH - Strong, rising ADX with -DI far above +DI, price below all key moving averages (including SMA200D), a bearish MACD, and a head-and-shoulders breakdown all favor further downside. Mild CMF and RSI divergences and the lower-band test argue for sharp bounces along the way, but the evidence favors a lower price in 48 days.
This is educational analysis and not financial advice.