NBIS 32-day bearish forecast — Nov 16, 2026
- Bias: Bearish
- Timeframe: 32 days (made Nov 16, 2026, target date Dec 18, 2026)
- Price at analysis: $107.13
- Price target: $99.00
- Expected range: $90.00 – $109.00
- Result: Pending — graded after the close on Dec 18, 2026
Get a free AI analysis of NBIS today
Analysis
TECHNICAL INDICATORS
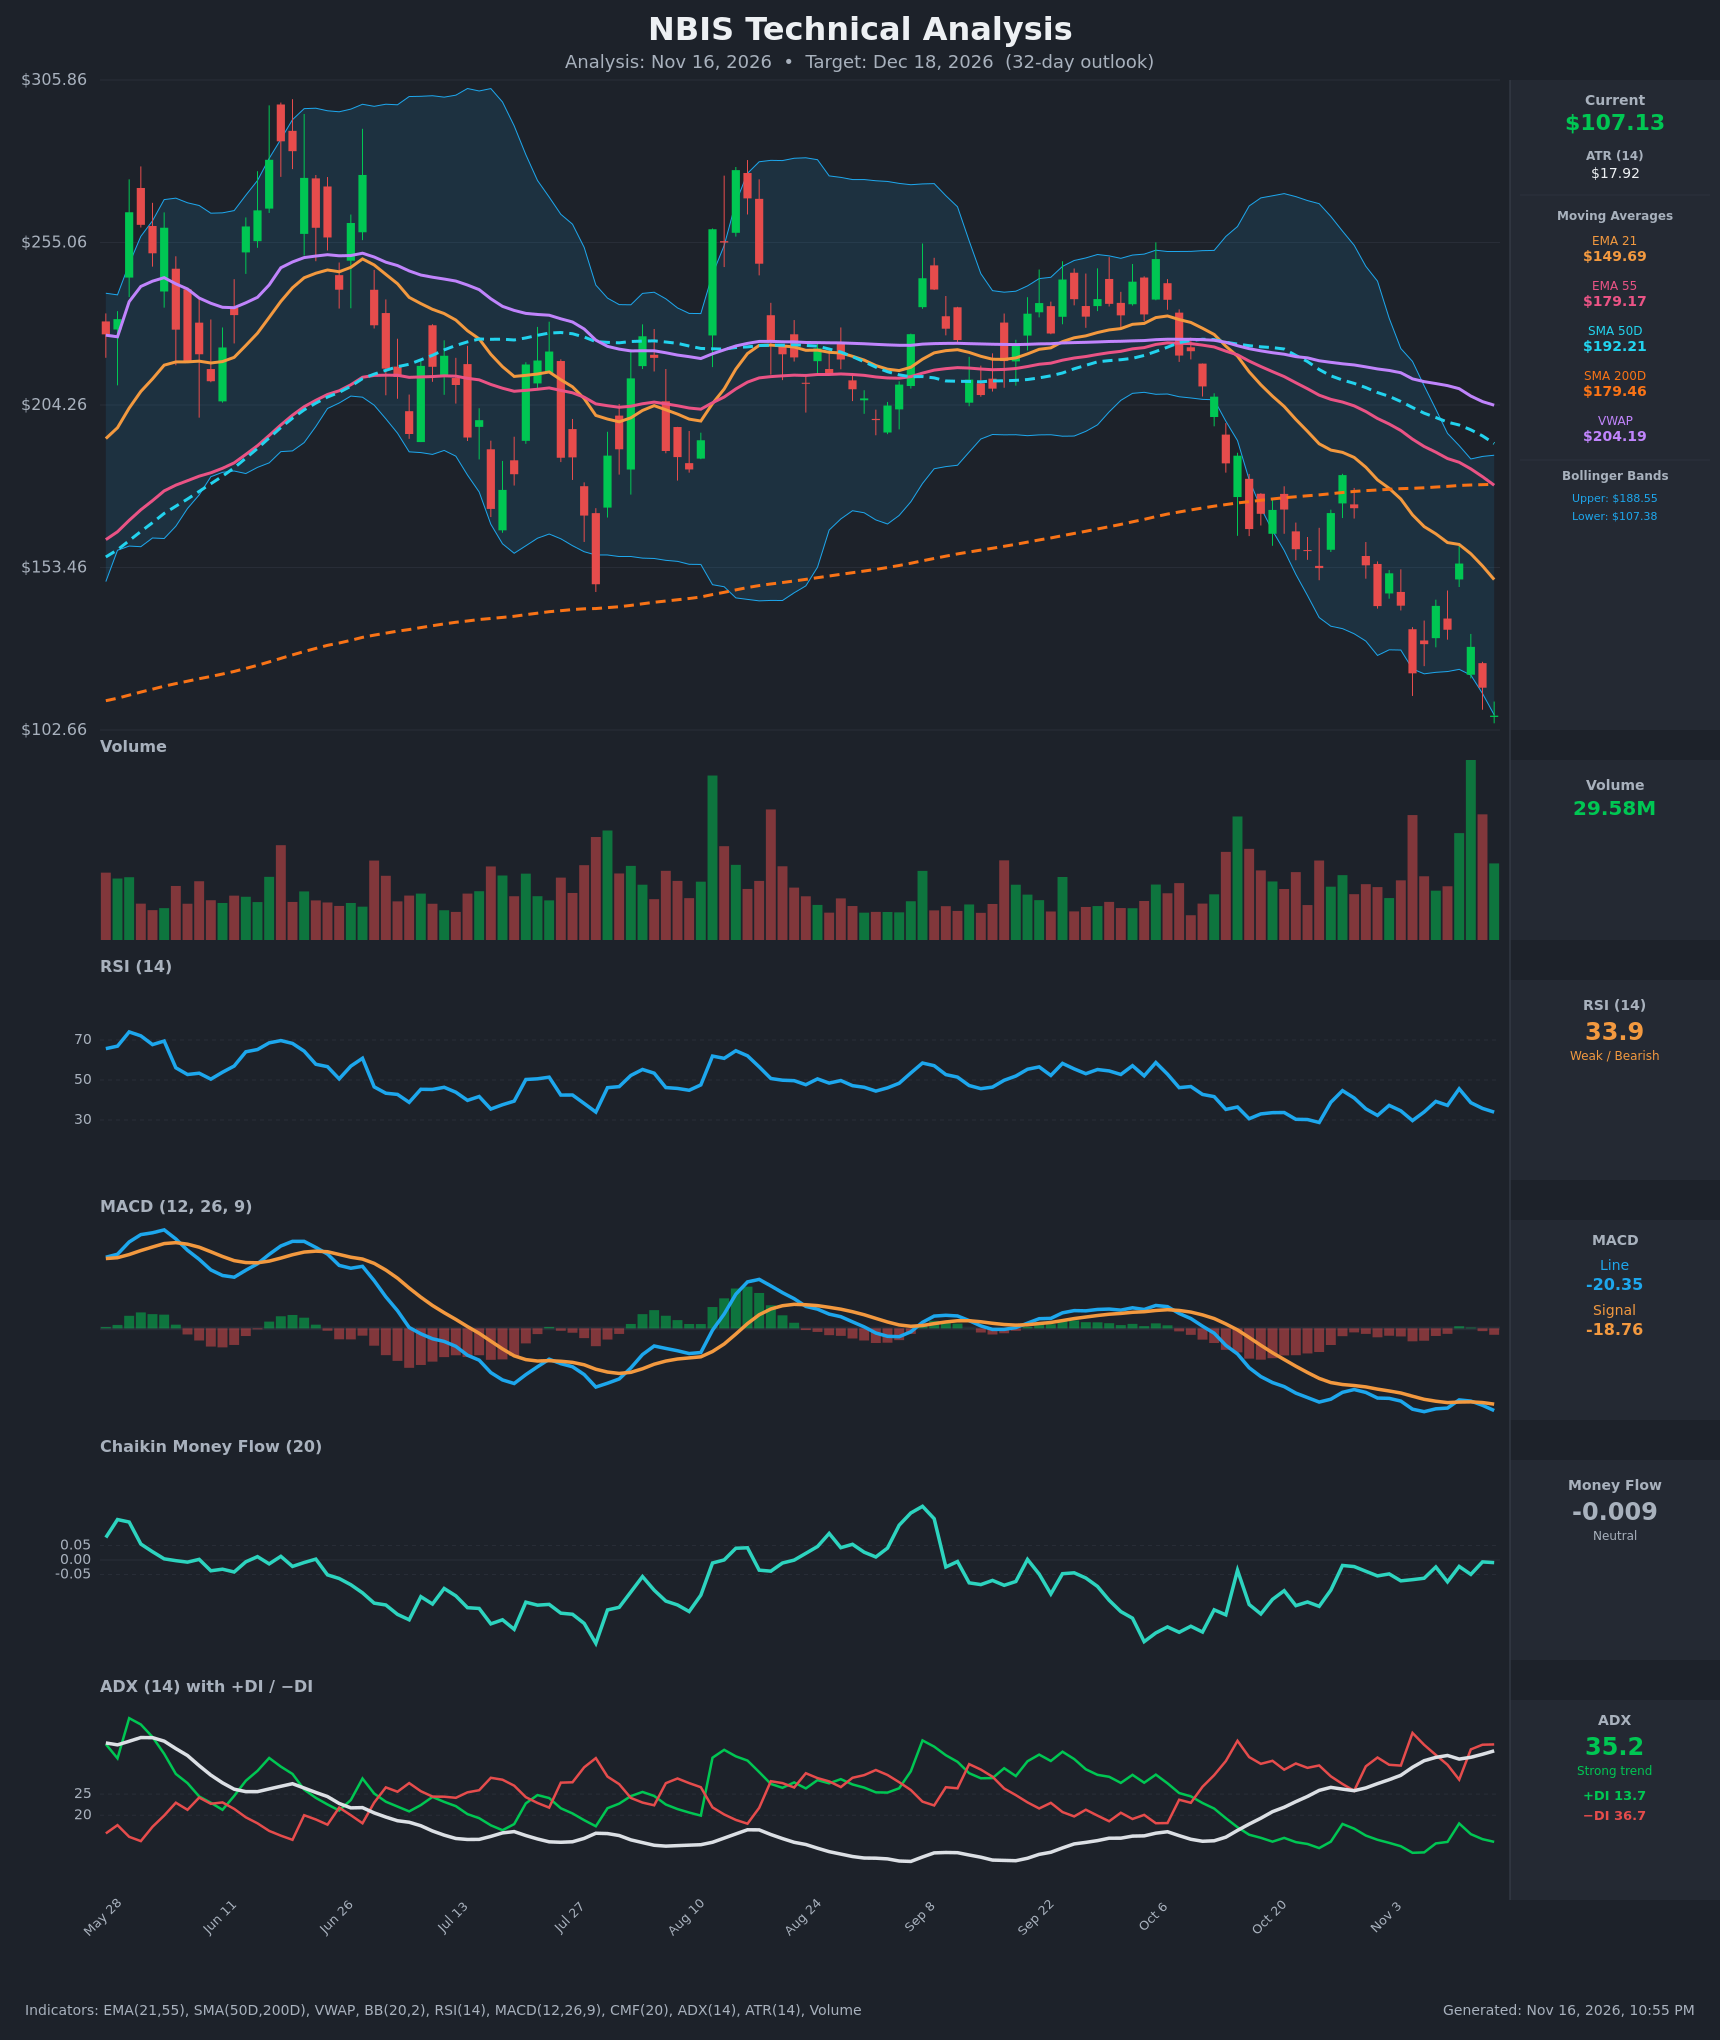
- RSI (14): 33.93, just above the 30 oversold line and not yet extreme. It has bounced between 29.7 and 45.6 over the last 15 bars and never regained 50. Price made a new low at $107.13 while RSI sits above its Nov 5 low of 29.7, a mild positive divergence. [Bearish]
- 20 EMA: The data gives EMA 21 at $149.69, about 28% above price, and it is falling steeply (from $190 on Oct 27). EMA 21 has been below EMA 55 ($179.17) for the whole window, so the short-term trend is firmly down. The EMAs act as heavy overhead resistance. [Bearish]
- MACD: Line -20.35 is below signal -18.76, a histogram of about -1.58. A brief bullish cross on Nov 11 (-17.72 vs -18.25) failed within a day. Both lines are deep in negative territory and still making new lows. [Bearish]
- Bollinger Bands (20): Upper $188.55, lower $107.38, so the mid-band is about $148. Price at $107.13 is at or just below the lower band after riding it down, with the bands very wide (high volatility). That signals a stretched, high-momentum downtrend, and it also raises the odds of a sharp relief bounce. [Bearish]
- CMF (20): -0.009, inside the neutral zone (±0.05). It has hovered near zero or slightly negative throughout the selloff, so selling has not been accompanied by clear distribution, and buyers are absorbing some of it. [Neutral]
- ADX (14): 35.2 and rising (from 26 on Oct 27), a strong trend. −DI at 36.7 is far above +DI at 13.7, so bears are firmly in control. [Strong Trend – Bearish]
- Volume: 29.58M, with the heaviest bars of the chart clustered in the last two weeks, mostly on red candles. This is expanding-volume selling, possibly approaching capitulation. A reversal would need a high-volume green bar to confirm. [Bearish with capitulation risk]
Other trend signals:
- Price is far below SMA200 ($179.46), SMA50 ($192.21) and VWAP ($204.19), all of which are falling or flat.
- SMA50 is closing on SMA200 (a gap of about $12.75, shrinking about $1.5–2 per day), so a death cross is likely within the window.
DIVERGENCES & TRENDS
- RSI divergence: Price made lower lows (Nov 5 close $120.37 to $107.13) while RSI is higher (29.7 to 33.9). This is a mild bullish divergence that warns of a bounce but is not a reversal signal on its own.
- MACD: No divergence. The MACD line is at a new low (-20.35 vs -20.01 on Nov 5), confirming the downtrend.
- Trend: The pattern is lower highs ($182 on Oct 28, $154.69 on Nov 11) and lower lows ($120 on Nov 5, $107 now).
- Crossovers:
- Price is below every moving average.
- EMA 21 is under EMA 55.
- SMA50 is converging on SMA200 and a death cross is approaching.
- The brief MACD bullish cross on Nov 11 failed.
- −DI has been above +DI throughout, and ADX is rising.
- Failed bounces: The Nov 11 rally to $154.69 was rejected under the EMA 21 and collapsed about 30% in 3 sessions, which shows how weak the demand is.
CHART PATTERNS
- There is no clean textbook reversal on the chart. The structure is a falling channel with lower highs and lower lows, following a topping range from June to October. It is closest to a Bearish Flag/Descending continuation after the October breakdown below the SMA200 and the $170–180 zone.
- The measured continuation target from the breakdown points to the low $100s and below, in line with the $102.66 chart low.
- A Bullish Falling Wedge is possible if the lows keep compressing and volatility contracts, but nothing is confirmed. It would need a break above about $130–$155 on strong volume.
- The prior Jun–Oct range ($204–$255) is the broken base and now acts as long-term resistance.
POTENTIAL SCENARIOS
- Scenario 1: Bearish Trend Continuation — Strong ADX with −DI dominance, a death cross forming and price below all averages favor further grinding lower, with a possible capitulation flush. Trigger: close below $102.66 (the chart low) with expanding volume. Target: $92–$100, with an extension to about $90. Invalidation: daily close above $120.37 with MACD crossing back above signal. (50% probability)
- Scenario 2: Bullish Oversold Relief Bounce — Price at the lower Bollinger Band, the RSI divergence and heavy capitulation-like volume could trigger a sharp mean-reversion bounce, but it would likely stall below the falling EMA 21. Trigger: reclaim of $115.88, then $120.37, on a high-volume green day. Target: $125–$135. Invalidation: loss of $102.66. (35% probability)
- Scenario 3: Neutral Base Building — Price chops in a volatile base between roughly $100 and $118 as selling exhausts. Trigger: several closes between $102 and $118 with ADX turning down. Target: about $105–$112. Invalidation: a decisive break outside the range. (15% probability)
PRICE TARGETS
- Target Price: $99.00 (32-day horizon)
- Expected Range: $90.00 to $109.00 (width $19, about 17.7% of the current price, in line with the 30–60 day guideline)
- Key Levels: Support at $102.66, Resistance at $115.88
Rationale: the trend and momentum evidence outweighs the oversold-bounce evidence, so I expect a modest downside drift. The bounce scenario would likely run into $115.88–$120.37 resistance first.
OVERALL BIAS
OVERALL BIAS: BEARISH - ADX of 35 with −DI far above +DI, price below all key moving averages, a negative MACD still making new lows and an approaching SMA50/SMA200 death cross all point lower. The mild RSI divergence and the lower-band touch raise the risk of a violent relief bounce, but they do not yet outweigh the trend.
This is educational analysis and not financial advice.