NBIS 34-day bearish forecast — Nov 15, 2026
- Bias: Bearish
- Timeframe: 34 days (made Nov 15, 2026, target date Dec 18, 2026)
- Price at analysis: $115.88
- Price target: $105.00
- Expected range: $94.00 – $114.00
- Result: Pending — graded after the close on Dec 18, 2026
Get a free AI analysis of NBIS today
Analysis
TECHNICAL INDICATORS
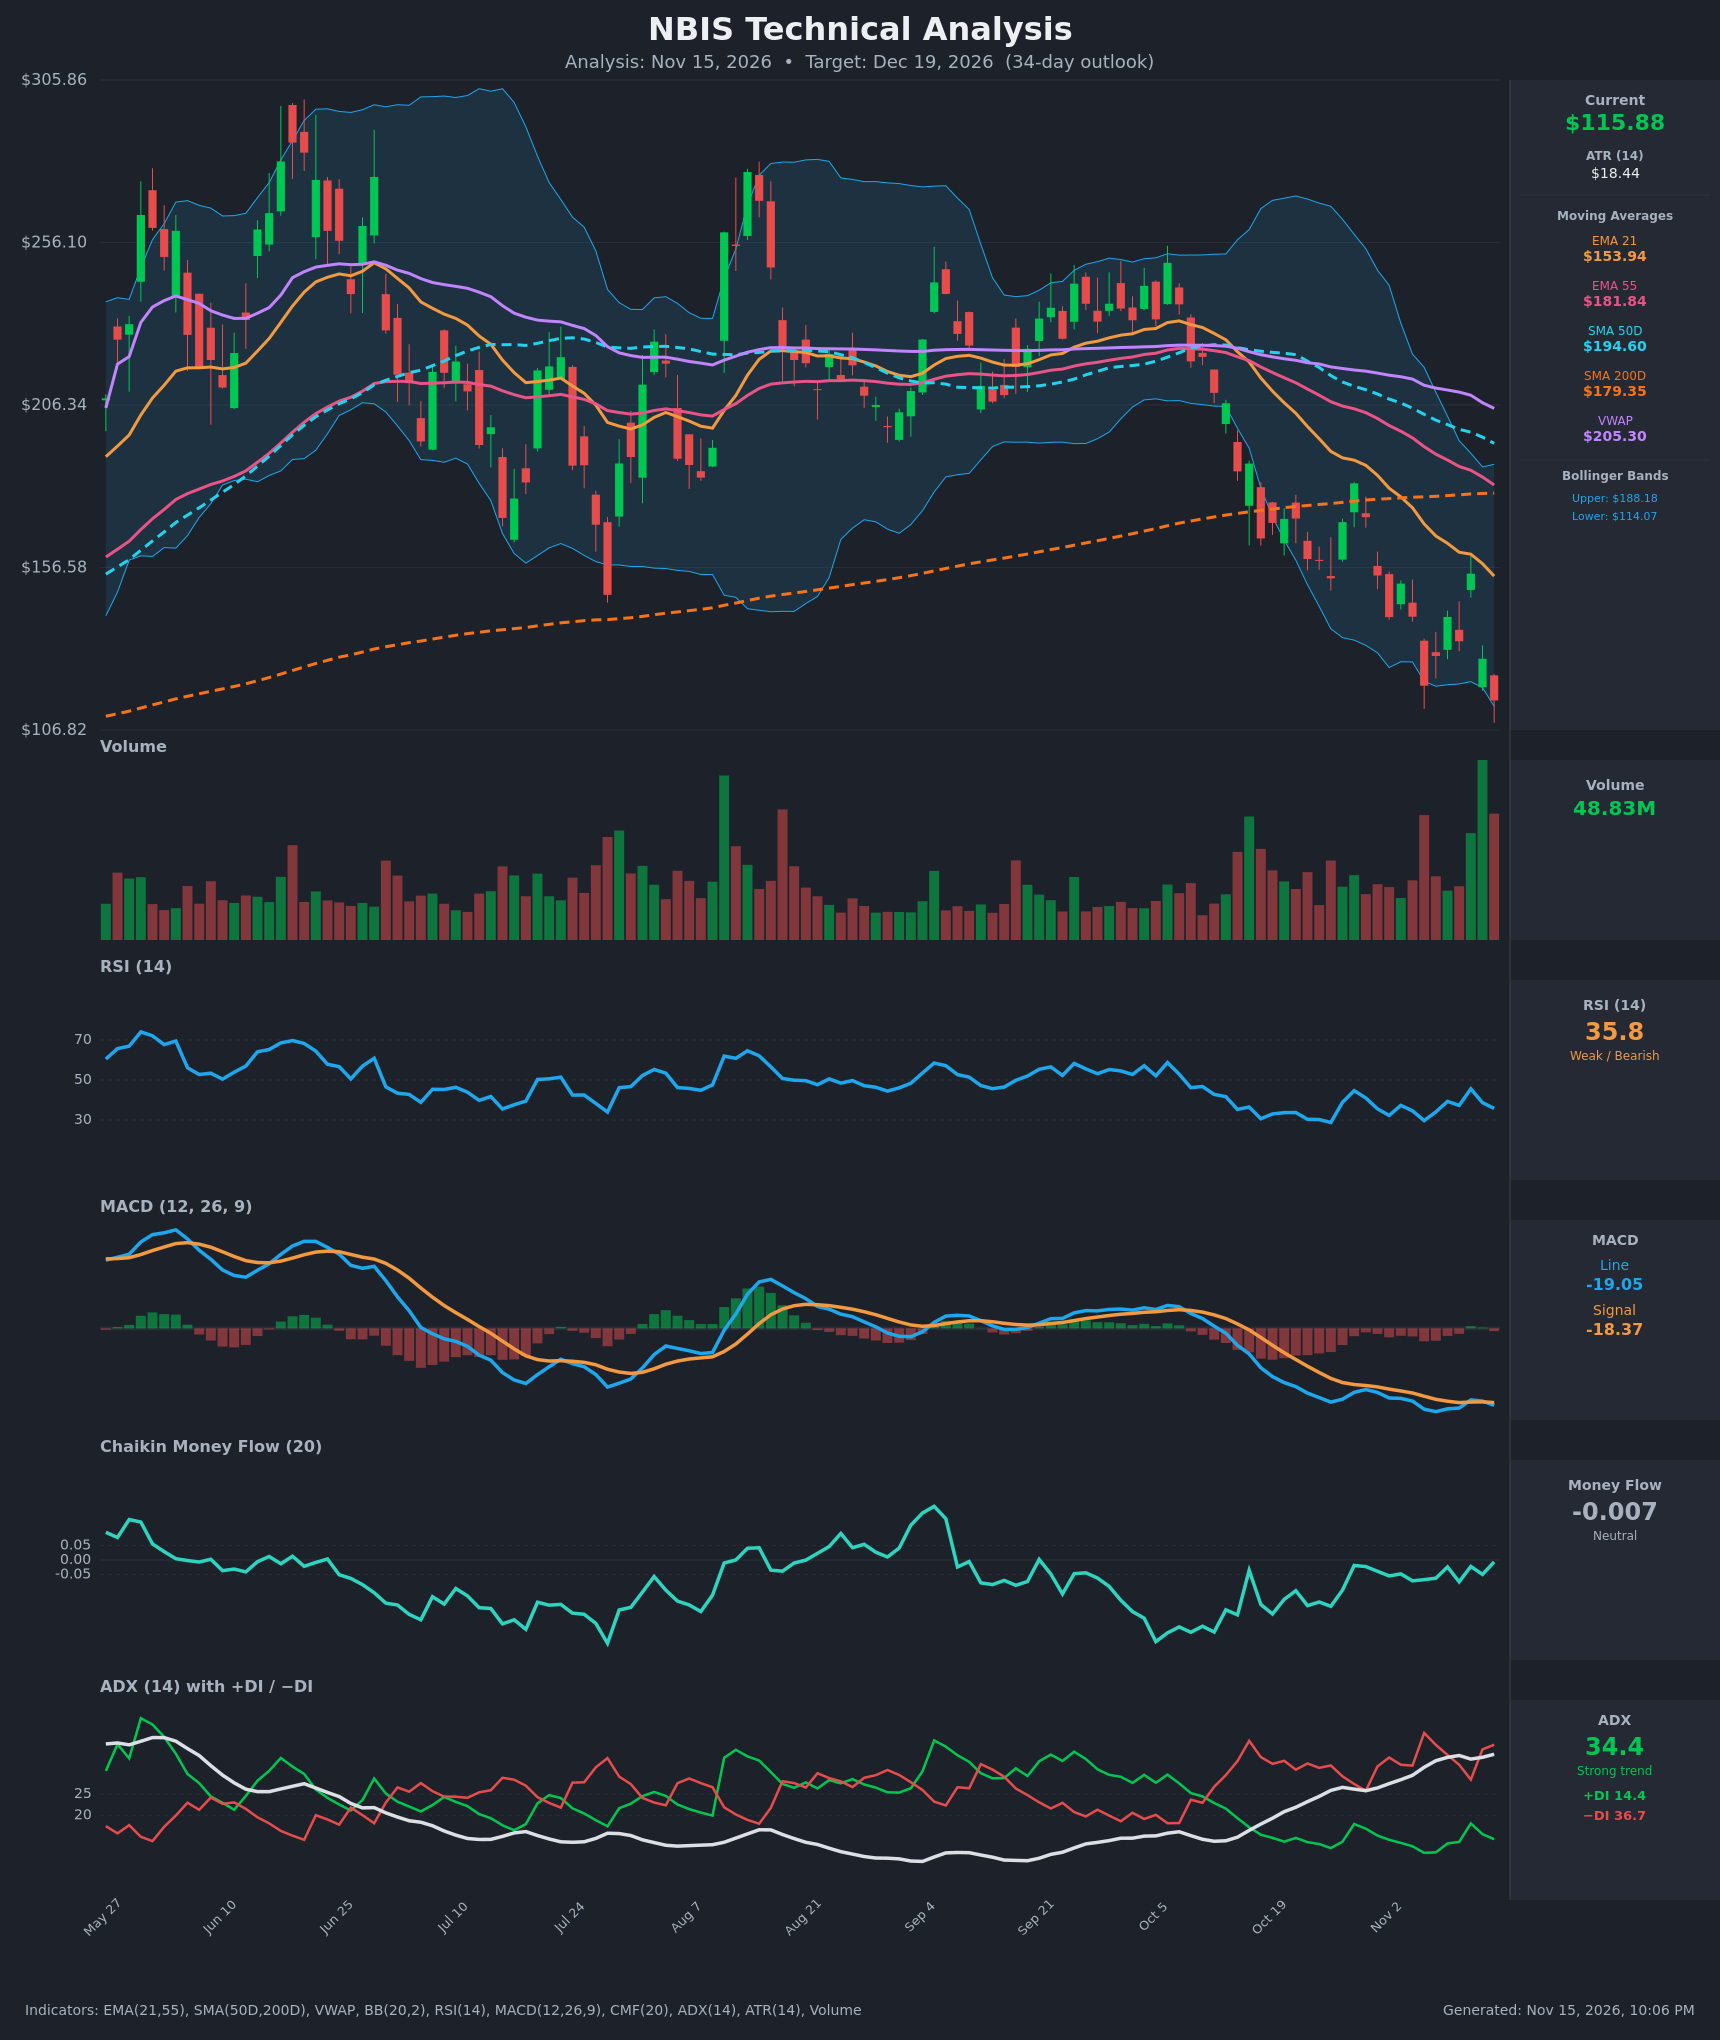
- RSI (14): 35.79, in the weak zone but not oversold (<30). It touched 28.8 on Oct 26 and 29.7 on Nov 5, and each bounce has stalled around 38-45. Momentum is still down, and the latest reading is below the Nov 11 peak of 45.6. [Bearish]
- 20 EMA: The chart plots EMA 21 at $153.94, about 33% above price. Price is far below it and the EMA is falling steeply (from $192 to $154 in 15 bars). EMA 21 is also well below EMA 55 ($181.84), so the bearish crossover is long established. [Bearish]
- MACD: Line -19.05 is below signal -18.37, so the histogram is slightly negative (about -0.68). The line re-crossed below the signal on Nov 12 after a brief attempt to cross on Nov 11. Both lines sit deep below zero and are still making new lows. [Bearish]
- Bollinger Bands (20): Price of $115.88 is hugging the lower band ($114.07), with the upper band at $188.18. Price has been walking the lower band, and the bands are wide and expanding downward. That signals trend-driven volatility, not yet a confirmed reversal. A stretched move invites a bounce, but the band walk reflects strong downside momentum. [Bearish]
- CMF (20): -0.007, inside the neutral band (±0.05). It has improved from -0.160 on Oct 26 and shows no heavy distribution lately. It is not confirming a bounce either. [Neutral]
- ADX (14): 34.4 and rising (from 25.8 on Oct 29), with −DI 36.7 far above +DI 14.4. This is a strong, well-established downtrend with bears firmly in control. [Strong Trend – Bearish]
- Volume: 48.83M, the highest bar on the chart, and recent bars are heavy on down days. This is either a capitulation spike or distribution on a breakdown. With price at a new low and no follow-through bounce yet, it leans toward trend confirmation. [Elevated – Bearish/Possible Capitulation]
DIVERGENCES & TRENDS
- Price vs RSI: Price made a new low ($115.88 vs $120.37 on Nov 5), while RSI (35.8) is higher than the Nov 5 low (29.7). This is a mild bullish divergence, but RSI never got oversold and the divergence is unconfirmed.
- Price vs MACD: MACD made a new low (-19.05 vs -20.6 on Nov 6) only marginally, and the line is rolling back under the signal. That is no meaningful divergence.
- CMF: It is improving from -0.16 to about zero while price falls. This is a mild bullish divergence, so selling pressure is fading but buyers are not yet stepping in.
- MA structure: Price is below EMA 21, EMA 55, SMA 50D ($194.60), SMA 200D ($179.35) and VWAP ($205.30). Price lost the SMA 200D in October.
- Death cross watch: SMA 50D ($194.60) is falling toward SMA 200D ($179.35). The gap has narrowed by about $1.5-2 per day, so a death cross is likely within the 34-day window.
- DI/ADX: −DI has been above +DI since early October with no sign of a bullish crossover. ADX is rising, which means the trend is strengthening.
- Trend: The Nov 13 close continues a series of lower highs ($182 → $154 → $155) and lower lows ($141 → $120 → $116), and each bounce fails below EMA 21.
CHART PATTERNS
- Bearish continuation structure: Price is in a descending channel of lower highs and lower lows. It resembles the Bearish Expanding Triangle / Bearish Flag from the reference: sharp rallies (e.g. $141 → $182) that fail, followed by new lows. The measured target is a further leg down.
- Large distribution top (Head-and-Shoulders-like): From June to October, price built a broad topping range around $215-$280. Price broke the neckline near $190-$200 (the SMA 50D/200D zone) and has cascaded lower. This is consistent with a Bearish Head and Shoulders breakdown. The projected target extends well below the current level, though that is beyond the 34-day horizon.
- Counter-pattern: If price stabilizes and forms contracting lower lows with falling volume, the structure could become a Bullish Falling Wedge. This is not confirmed, because the swings are widening, not narrowing.
- Targets: The bearish measured move points to the low $100s. A relief rally has resistance at $128-$135, then EMA 21 at $153.94.
POTENTIAL SCENARIOS
- Scenario 1: Bearish Trend Continuation — −DI dominance, a rising ADX, a MACD below its signal and a likely SMA death cross keep sellers in control. Price walks the lower Bollinger Band and makes new lows, with rallies capped below $130. Trigger: a daily close below $108-$110 (the recent wick/axis lows). Target: $100-$106, with an extension into the $90s. Invalidation: a daily close above $135 on rising volume. (52% probability)
- Scenario 2: Bullish Oversold Relief Bounce — The heavy-volume spike at the lower band is a capitulation attempt, with a mild RSI/CMF divergence. Price mean-reverts toward the Bollinger midline. Trigger: a close above $129.50 (the Nov 6/12 area) and a MACD histogram flip positive. Target: $135-$154 (EMA 21 as the ceiling). Invalidation: a failure to hold $108 or a rejection at $129. (35% probability)
- Scenario 3: Neutral Basing Range — Price stabilizes between $105 and $130 as volatility compresses, with ADX rolling over. Trigger: lower volume and an RSI holding 30-45. Target: $110-$125. Invalidation: a close outside $105-$135. (13% probability)
PRICE TARGETS
- Target Price: $105.00 (34-day horizon)
- Expected Range: $94.00 to $114.00 (width $20.00 ≈ 17.3% of the current price, consistent with the 30-60 day guidance of 12-18%)
- Key Levels: Support at $106.80, Resistance at $129.50
OVERALL BIAS
OVERALL BIAS: BEARISH - Price is below every moving average and VWAP, with −DI (36.7) far above +DI (14.4), ADX at 34.4 and rising, a MACD below its signal and price walking the lower Bollinger Band. The oversold bounce case is credible given the mild RSI/CMF divergence, but it has the weaker evidence.
This is educational analysis and not financial advice.