NBIS 62-day bearish forecast — Nov 15, 2026
- Bias: Bearish
- Timeframe: 62 days (made Nov 15, 2026, target date Jan 15, 2027)
- Price at analysis: $115.88
- Price target: $104.00
- Expected range: $88.00 – $120.00
- Result: Pending — graded after the close on Jan 15, 2027
Get a free AI analysis of NBIS today
Analysis
TECHNICAL INDICATORS
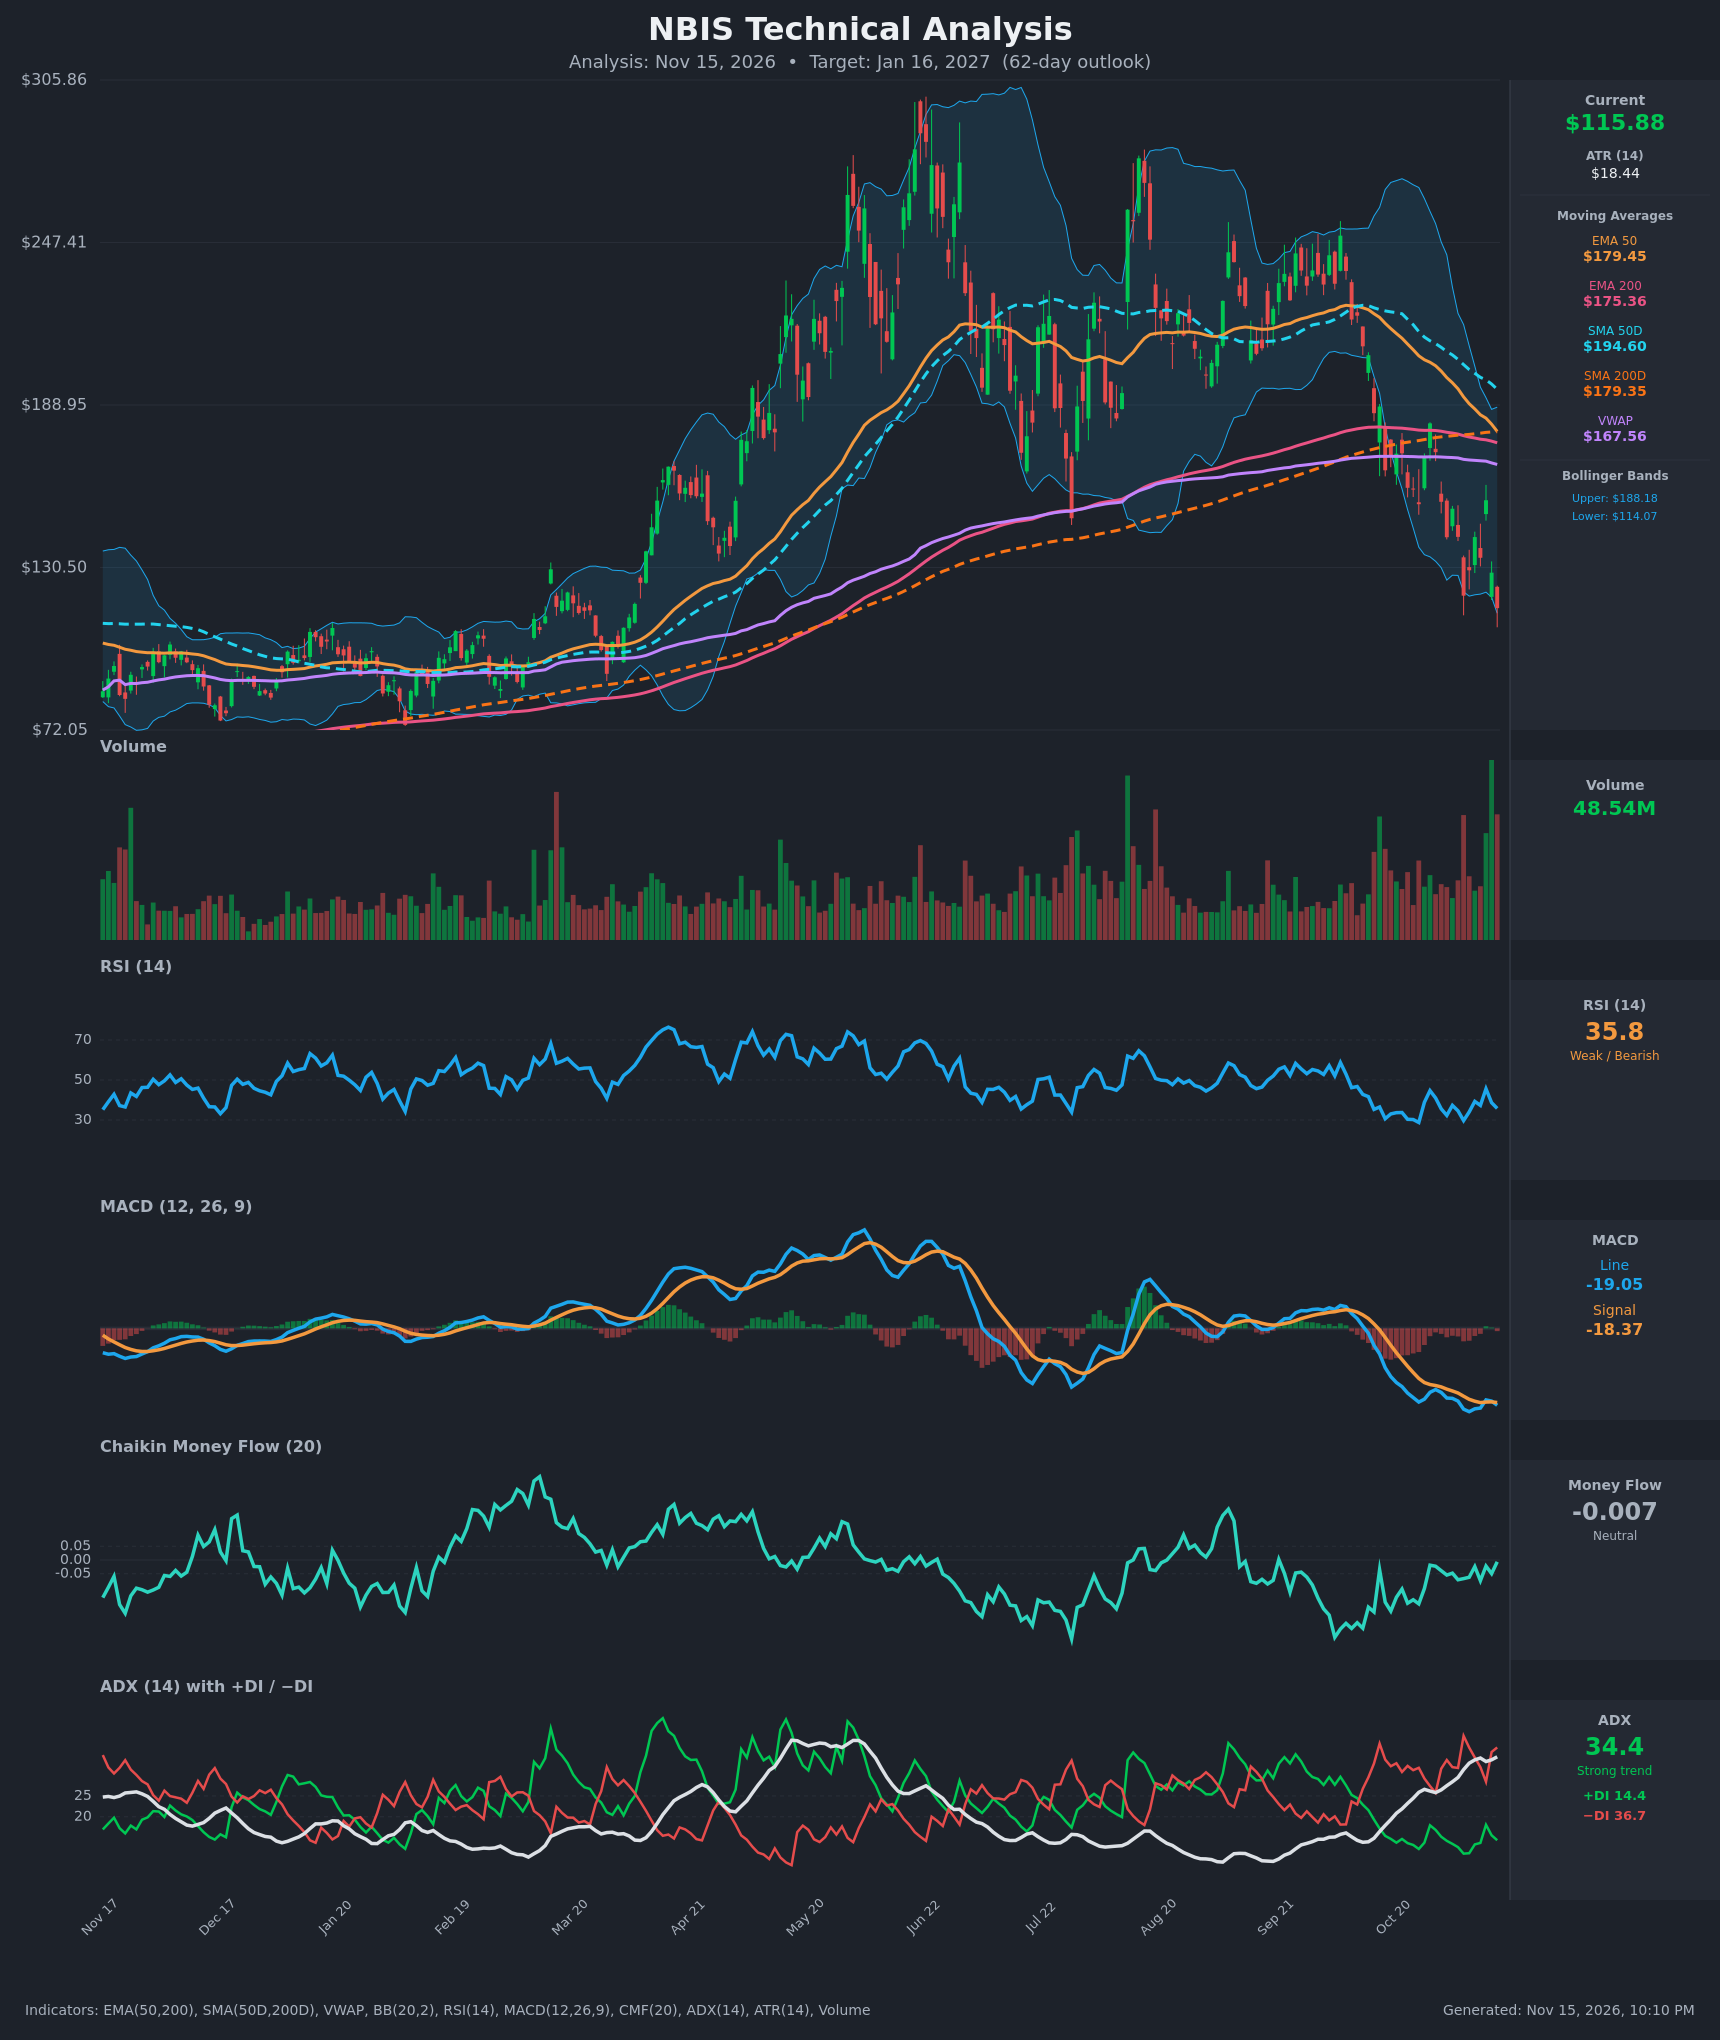
- RSI (14): 35.79, near but not in oversold territory (<30). It touched 29.7 on Nov 5 and has since made a higher low even as price made a lower low, so downside momentum is easing slightly. Still below 50 and in a bearish regime. [Bearish]
- 20 EMA / Moving Averages: No EMA20 value was supplied, so I use the provided averages. Price at $115.88 is far below EMA50 ($179.45, about 35% above price), EMA200 ($175.36), SMA50D ($194.60), SMA200D ($179.35) and VWAP ($167.56). Every average is overhead resistance. EMA50 is closing on EMA200 (a $4 gap) and SMA50D is converging on SMA200D (a $15 gap), so bearish crossovers are imminent. [Bearish]
- MACD: Line -19.05 is below Signal -18.37, with a small negative histogram of about -0.68. It crossed up briefly on Nov 11 (-17.7 vs -18.2) and rolled back under on Nov 12. Both lines sit deeply negative near the cycle lows, which is a bearish regime, but the lack of new MACD lows (-20.6 on Nov 6) hints at slowing downside. [Bearish]
- Bollinger Bands (20): Price is $115.88 against a lower band of $114.07, an upper band of $188.18 and a midline near $151. Price is walking the lower band after a collapse from the upper band, and the bands are very wide, showing extreme volatility. This is a trend-continuation signal in a strong downtrend, though it also raises odds of a snap-back toward the midline. [Bearish]
- CMF (20): -0.007, inside the neutral band (±0.05). It has recovered from -0.16 on Oct 26 to roughly zero, so heavy distribution has faded, but there is no accumulation yet. [Neutral]
- ADX (14): 34.4 and rising (from 25.9 on Oct 26), with −DI 36.7 far above +DI 14.4. This is a strong, accelerating downtrend with bears firmly in control. [Strong Trend – Bearish]
- Volume: 48.54M, among the largest bars on the chart, on a red candle that broke to new lows. Heavy volume on a breakdown confirms selling pressure, though it could also mark capitulation. A reversal would need follow-through buying to confirm that. [Bearish with capitulation risk]
DIVERGENCES & TRENDS
- Mild bullish divergence: price made a lower low ($120.37 on Nov 5 to $115.88 now) while RSI made a higher low (29.7 to 35.8). MACD also has not undercut its Nov 6 low of -20.6. This hints at fading momentum but is not confirmed by a reversal.
- Trend: the stock has fallen from about $305 to $116, with lower highs through Aug and Sep and a break of the July swing low near $150. The 15-bar closes show repeated failed bounces ($182, $154, $152, $155), each capped by lower highs.
- Crossovers:
- EMA50 ($179.45) is about to cross below EMA200 ($175.36).
- SMA50D ($194.60) is falling toward SMA200D ($179.35), so a death cross is likely within weeks.
- Price is far below SMA200D, a long-term downtrend signal.
- −DI crossed above +DI in late Oct and the gap has widened.
- CMF has recovered to about zero while price keeps falling, a minor bullish divergence, but it is not decisive.
CHART PATTERNS
- Broad bearish topping structure (Bearish Head and Shoulders / lower-high triple top): peaks at about $300 (Jun), $270 (Aug) and $260 (Sep) with a neckline near $150, which was broken decisively in Oct–Nov. The measured move is very large and unrealistic over 62 days, but it shows the structural damage. The next real support is the Dec–Mar base around $90–$105.
- Bearish continuation tendencies: the sequence of lower highs and lower lows since Sep is a descending channel. Failed bounces below the declining averages resemble a bearish flag, with a measured downside extension toward the $90–$100 zone.
- Relief-rally risk: price sits at the lower Bollinger Band with a record-volume bar and mild positive divergences. A bounce toward $130–$142 is plausible before the trend resumes.
POTENTIAL SCENARIOS
- Scenario 1: Bearish Trend Continuation — The strong downtrend (ADX 34, −DI dominant) persists. Rallies fail below $130–$142, and a death cross adds pressure. Price drifts into the Dec–Mar base area. Trigger: daily close below $114 (lower BB) and the Nov 5 low of $120 failing as resistance. Target: $100, with an extension to about $90. Invalidation: daily close above $142 on strong volume. (50% probability)
- Scenario 2: Bullish Capitulation Bounce — The record-volume flush marks a capitulation low. Positive RSI/MACD divergences play out and price mean-reverts toward the BB midline and the declining averages. Trigger: close above $129.50 with a bullish MACD crossover and CMF above +0.05. Target: $142 to $155. Invalidation: close below $108. (32% probability)
- Scenario 3: Neutral Basing Range — Price chops between about $105 and $135 as volatility contracts and the downtrend stalls. Trigger: ADX rolls over below 30 with repeated holds above $110. Target: $115 to $125. Invalidation: close outside the $100 to $142 range. (18% probability)
PRICE TARGETS
- Target Price: $104.00 (62-day horizon, Jan 16, 2027)
- Expected Range: $88.00 to $120.00 (width $32 = about 27.6% of current price, consistent with the 61–180 day guidance)
- Key Levels: Support at $100.00 (immediate support at the $114.07 lower Bollinger Band), Resistance at $129.50
OVERALL BIAS
OVERALL BIAS: BEARISH - Price is below every moving average with ADX at 34 and rising, −DI (36.7) far above +DI (14.4), MACD below signal in negative territory and a death cross looming. Mild bullish divergences and the lower-band location make conviction modest and a relief bounce possible, but trend evidence favors further downside toward the $100 area.
This is educational analysis and not financial advice.