NBIS 27-day bearish forecast — Nov 15, 2026
- Bias: Bearish
- Timeframe: 27 days (made Nov 15, 2026, target date Dec 11, 2026)
- Price at analysis: $115.88
- Price target: $105.00
- Expected range: $96.50 – $116.50
- Result: Pending — graded after the close on Dec 11, 2026
Get a free AI analysis of NBIS today
Analysis
TECHNICAL INDICATORS
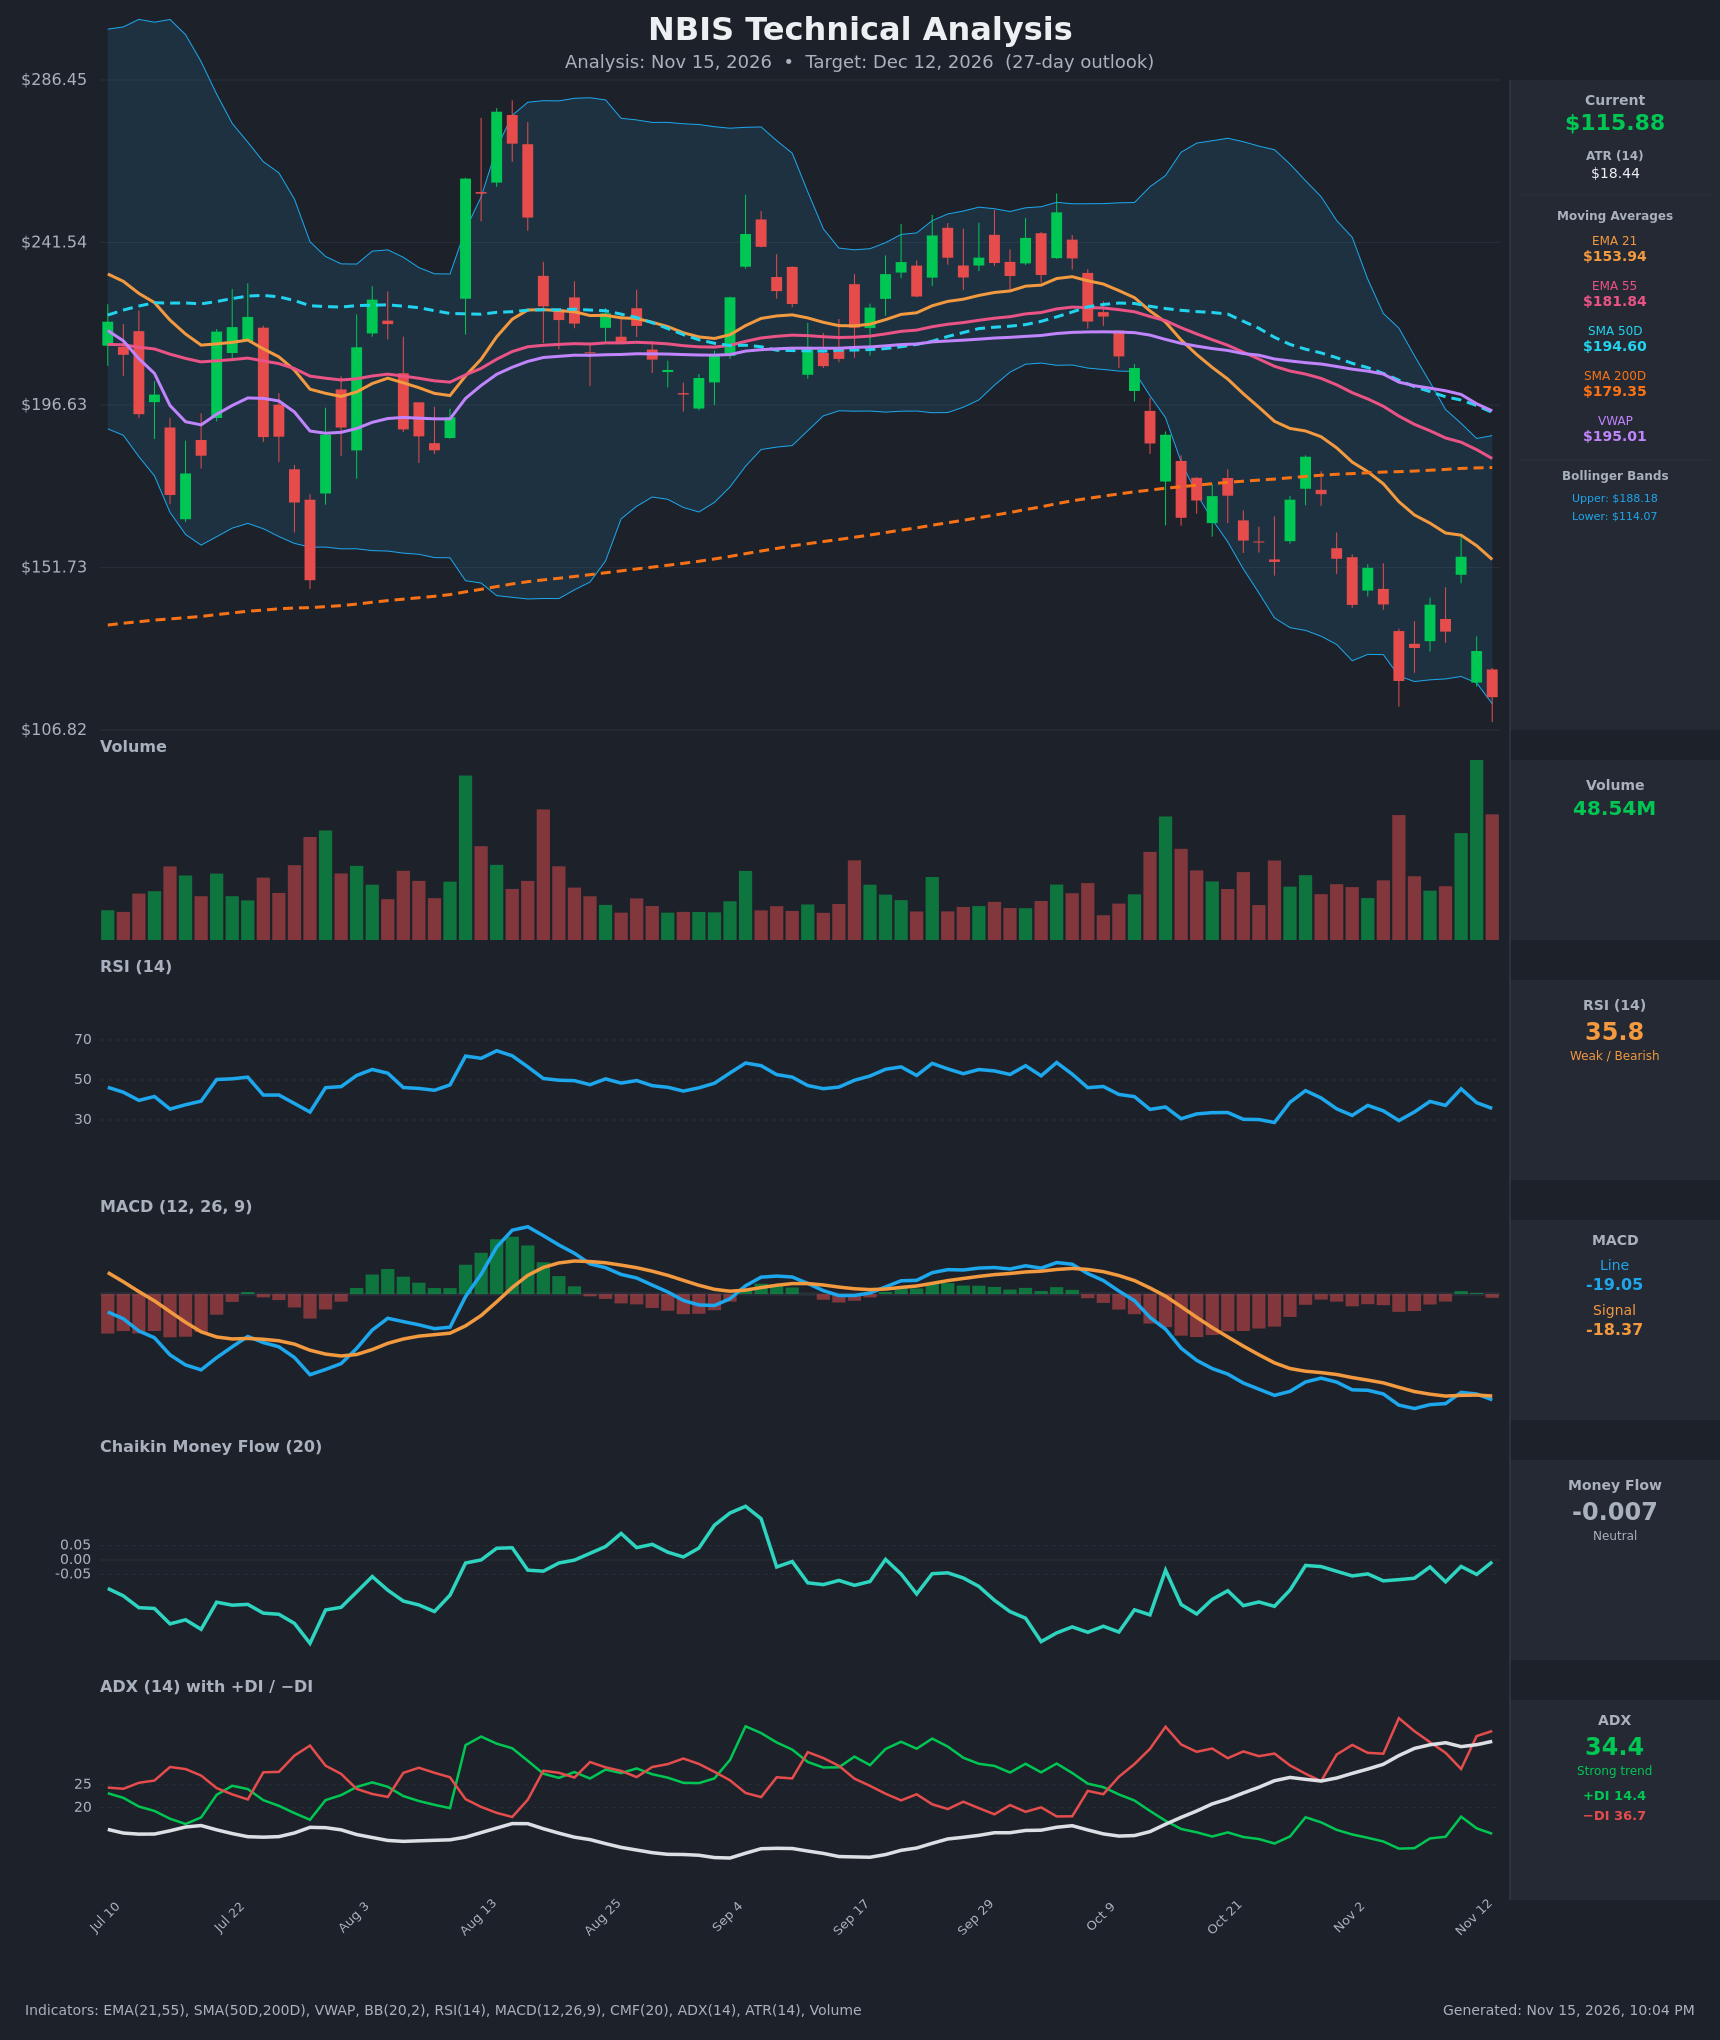
- RSI (14): 35.79, in the weak zone but not yet oversold (<30). It hit 28.8 on Oct 26 and 29.7 on Nov 5, and the current reading is higher than the Nov 5 low even though price is lower, so momentum is stabilizing slightly. [Bearish]
- 20 EMA (EMA 21): $153.94, with price about 25% below it, so it acts as heavy overhead resistance. EMA 21 is also below EMA 55 ($181.84), a bearish crossover that is widening. Price is also under SMA50D ($194.60), SMA200D ($179.35) and VWAP ($195.01). [Bearish]
- MACD: Line -19.05 is below Signal -18.37, with a small negative histogram of about -0.68. It briefly crossed up on Nov 11, then rolled back down on Nov 12. The line is deep in negative territory, but it is higher than its Nov 6 trough of -20.63 while price has made a lower low. [Bearish]
- Bollinger Bands (20): Price at $115.88 is hugging the lower band ($114.07), with the upper band at $188.18. Bands are wide and expanding downward, which fits a strong trend ("walking the band") rather than a squeeze. A touch of the lower band can bring a bounce, but it is not a reversal signal on its own. [Bearish]
- CMF (20): -0.007, which is neutral (between -0.05 and +0.05). It has improved from -0.16 on Oct 26 and shows no heavy distribution at the lows, but it also shows no accumulation. [Neutral]
- ADX (14): 34.4 and rising, with −DI (36.7) far above +DI (14.4). The trend is strong and bears control it. ADX has risen steadily from about 26 in late October. [Strong Trend – Bearish]
- Volume: 48.54M on the latest bar is among the highest in the visible history, on a red down candle that made a new low. High volume on a breakdown confirms selling pressure. It could also mark a capitulation climax, but that needs a follow-through bounce to confirm. [Bearish with capitulation risk]
DIVERGENCES & TRENDS
- Possible bullish divergence: Price made a lower low ($115.88 vs. the Nov 5 close of $120.37), while RSI (35.8 vs. 29.7) and the MACD line (-19.05 vs. -20.63) did not confirm. This is an early warning that selling momentum is fading, but it is unconfirmed without a MACD bullish cross or a close back above the EMA 21 area.
- Trend structure: The chart shows lower highs and lower lows since the October breakdown. Every bounce (Oct 28 at $182, Nov 3 at $152, Nov 11 at $155) was sold at lower levels.
- Moving-average structure: EMA 21 is below EMA 55 and price is below SMA200D. SMA50D ($194.60) is still above SMA200D ($179.35) but the gap is closing fast, so a death cross is likely in the coming weeks if price does not rebound.
- DI and ADX: −DI has been above +DI since Oct 30, and ADX is rising. This supports a trend that is still gaining strength.
- CMF: It has recovered from -0.16 to neutral, so distribution is easing, but there is no buying pressure yet.
CHART PATTERNS
- Bearish Head and Shoulders (reversal): The left shoulder is the July peak, the head is the August spike near $280, and the right shoulder is the September–early October high near $250. The neckline around $190–196 broke in October. The measured move (head about $280 minus neckline about $195 = about $85) projects to roughly $110, which price is now approaching. This suggests much of the pattern's target may already be achieved, so downside beyond it needs fresh momentum.
- Bearish Flag / Pennant (continuation): The choppy Nov 9–12 bounces ($141–$155) inside a falling structure resolved lower. That is a bearish continuation signal and supports further weakness.
- Bearish Expanding Triangle character: The wide swings (ATR of $18.44, about 16% of price) show unstable, high-volatility price action. A relief bounce can retrace sharply, so risk is two-sided.
POTENTIAL SCENARIOS
- Scenario 1: Bearish Trend Continuation — Price stays below all moving averages, with −DI dominant and ADX above 30. Rallies fail around the EMA 21 and prior-close zone near $129, and price breaks the $107 intraday low and approaches the round $100 area. Trigger: Daily close below $107. Target: $100–$105. Invalidation: Daily close above $130 with MACD bullish crossover. (50% probability)
- Scenario 2: Bearish Relief Bounce Then Failure — The RSI/MACD divergence and the lower-band touch produce a snap-back toward $125–$135, but it stalls below the declining EMA 21 ($154) and resistance near $129–$141, then rolls over again. Trigger: Reclaim of $120 followed by a close above $129. Target: $130–$140 on the bounce, then a fade back toward $115. Invalidation: Daily close above $155 (EMA 21). (30% probability)
- Scenario 3: Bullish Capitulation Reversal — Heavy volume at the low marks a selling climax, CMF turns positive, MACD crosses up, and price recovers toward the $150–$155 EMA 21 zone. Trigger: Close above $141 with expanding volume and a MACD bullish cross. Target: $150–$155. Invalidation: Close below $107. (20% probability)
PRICE TARGETS
- Target Price: $105.00 (27 days, Dec 12, 2026)
- Expected Range: $96.50 to $116.50 (width $20.00, about 17.3% of current price, consistent with the 30–60 day band scaled down for 27 days, and in line with ATR volatility)
- Key Levels: Support at $107.00 (recent intraday low, with $100.00 as the next psychological level), Resistance at $129.50 (recent Nov 6 and Nov 12 close zone, with the EMA 21 near $154 above that)
OVERALL BIAS
OVERALL BIAS: BEARISH - Price is below every moving average, with ADX at 34.4 and −DI (36.7) well above +DI (14.4). A breakdown on heavy volume and a bearish MACD/EMA structure support further downside, although the RSI/MACD divergence and the lower-band touch raise the risk of a sharp relief bounce, so conviction is moderate.
This is educational analysis and not financial advice.