NBIS 4-day bearish forecast — Nov 1, 2026
- Bias: Bearish
- Timeframe: 4 days (made Nov 1, 2026, target date Nov 4, 2026)
- Price at analysis: $154.10
- Price target: $151.00
- Expected range: $144.50 – $158.50
- Result: Correct (-8.2%) — closed at $141.52 on Nov 4, 2026; quality score 51/100
Get a free AI analysis of NBIS today
Analysis
TECHNICAL INDICATORS
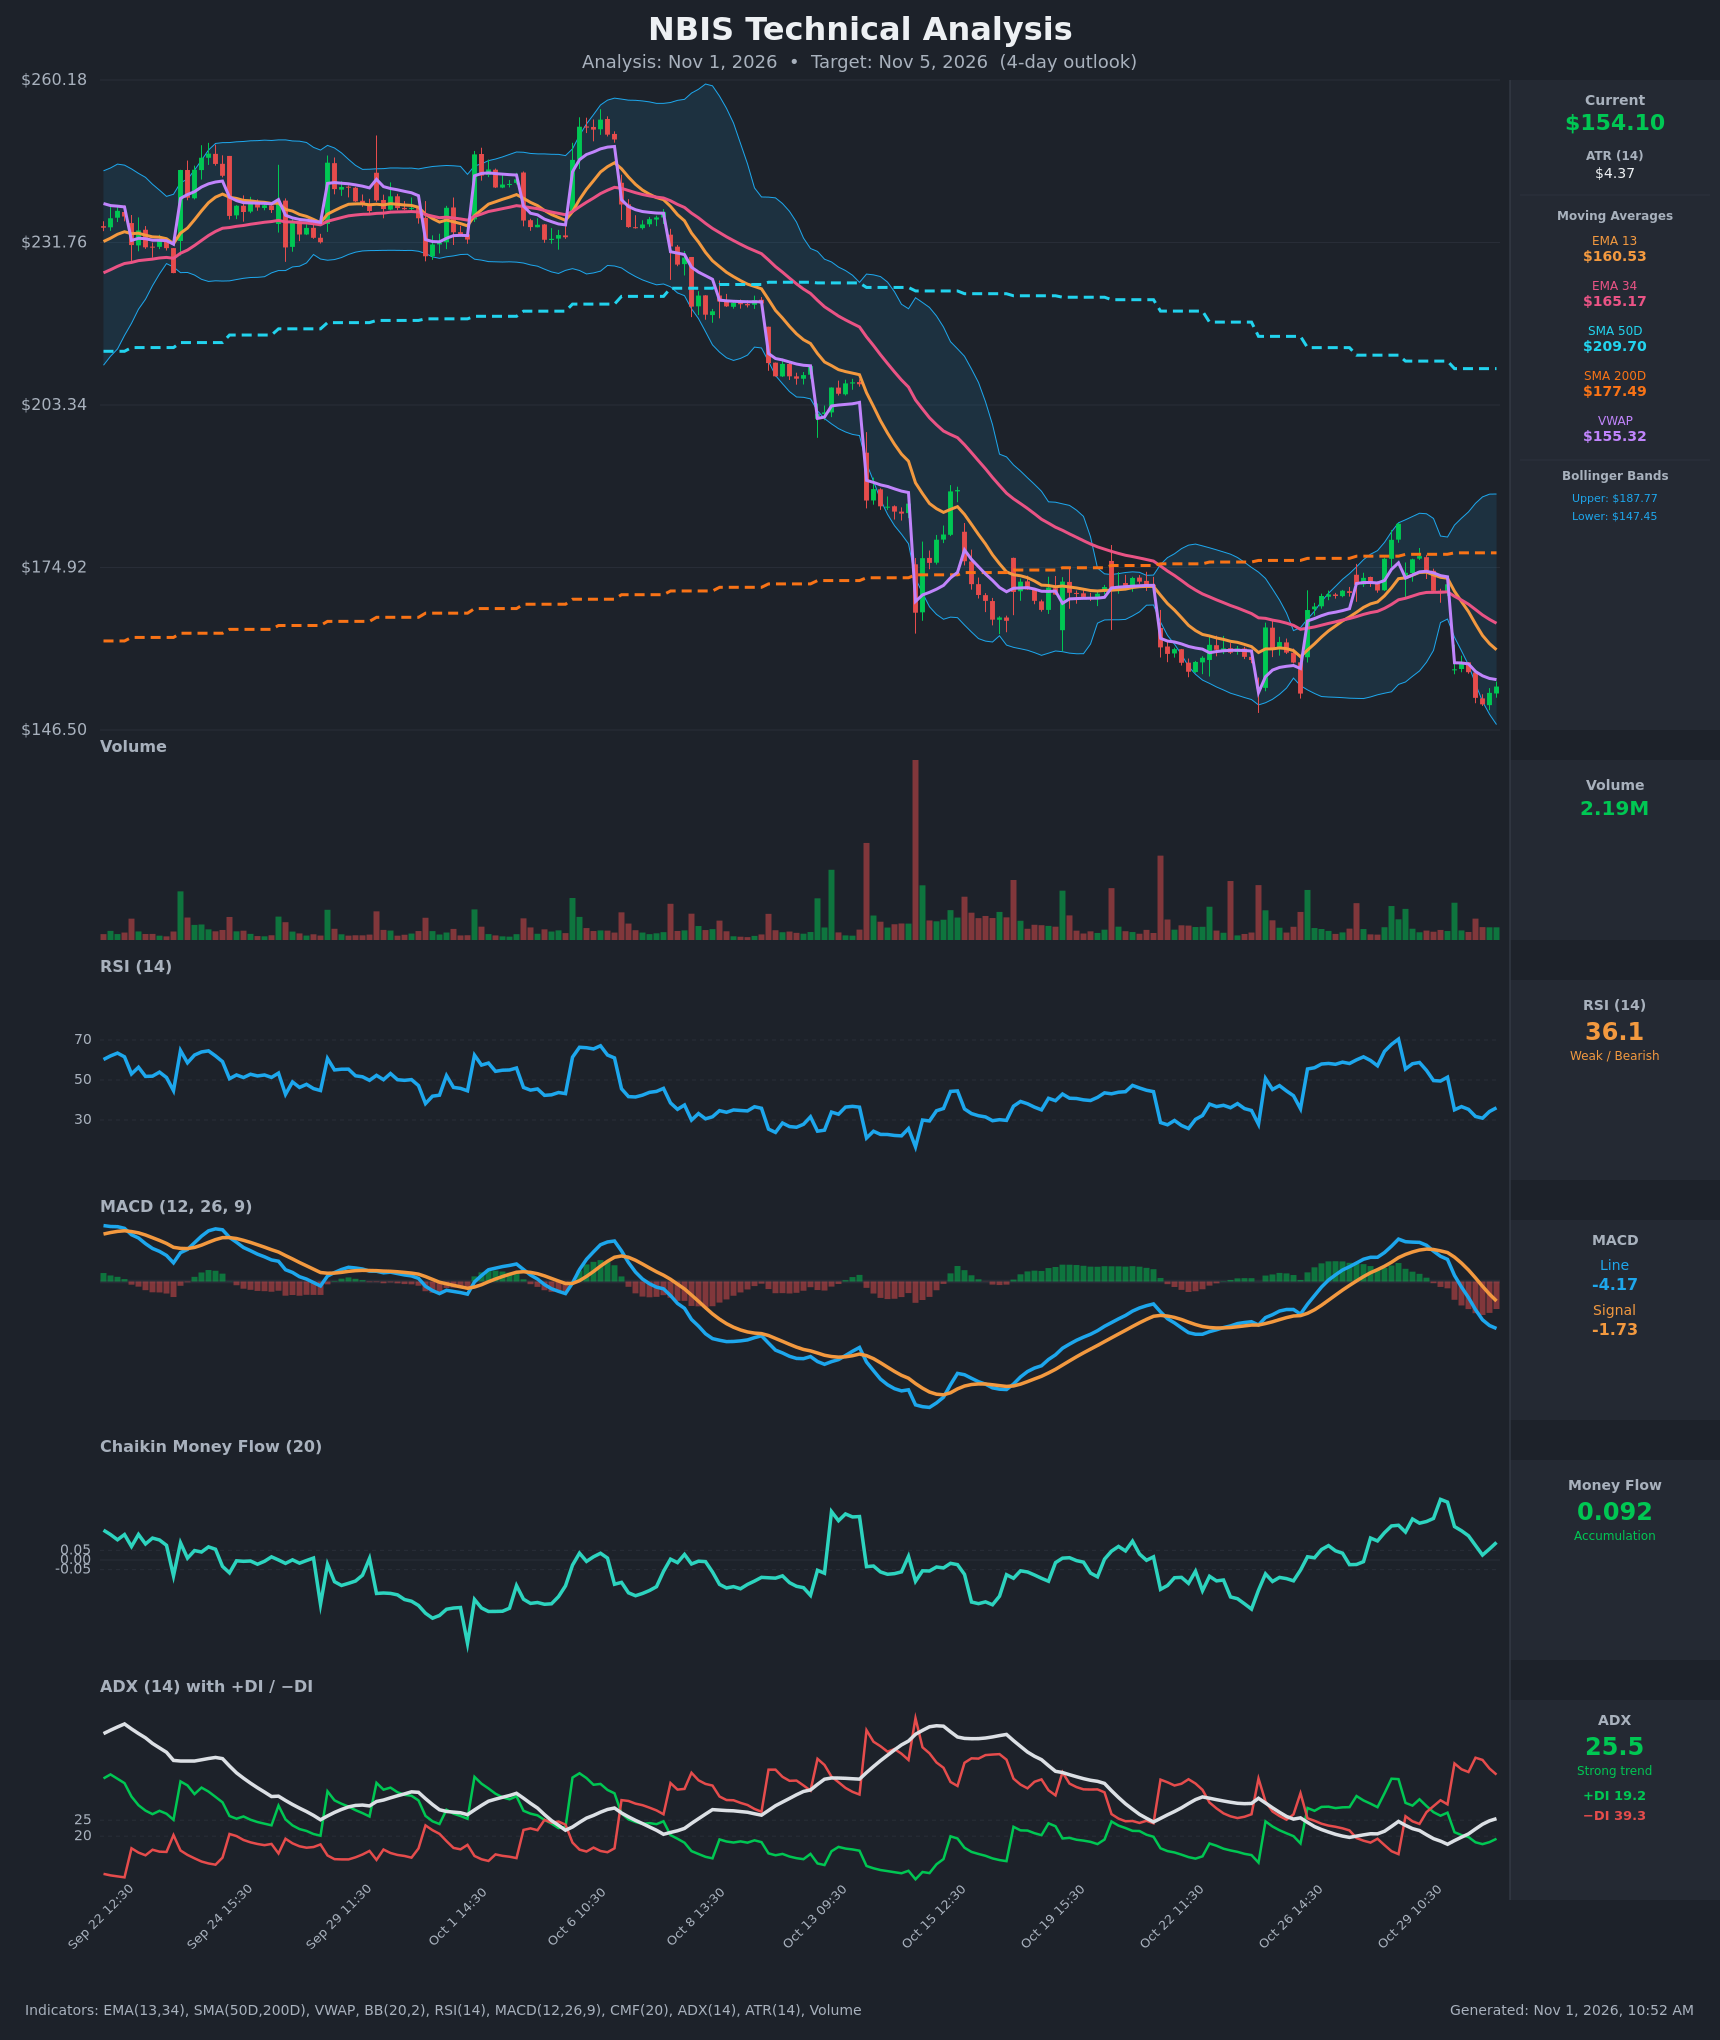
- RSI (14): 36.10, up from a low of 30.9 on Oct 30 13:30 but still below 50. Momentum is weak and has not yet reached oversold. The bounce from 30.9 to 36.1 is a minor recovery inside a larger downswing. [Bearish]
- EMA 13 / EMA 34: EMA13 is $160.53 and EMA34 is $165.17. Price at $154.10 is below both, and EMA13 crossed below EMA34 around Oct 30 10:30, a fresh bearish crossover. Both averages are sloping down and act as overhead resistance. [Bearish]
- MACD: Line is -4.17 and signal is -1.73, so the line is below the signal and the gap is widening. The bearish cross happened on Oct 30 at about 13:30, and the histogram is increasingly negative. Momentum is still deteriorating. [Bearish]
- Bollinger Bands (20): Upper band is $187.77 and lower band is $147.45. Price at $154.10 sits in the lower quarter of the bands, just above the lower band. The bands are wide after the volatile Oct 30 gap down. Price is walking near the lower band, which is a sign of strong downside pressure, though a bounce toward the midline (~$167) is possible. [Bearish]
- CMF (20): 0.092, above the +0.05 threshold. It has stayed positive through the selloff, which suggests some dip buying, but it is off its recent peak and has been falling since Oct 29. This conflicts with price and momentum. [Accumulation]
- ADX (14): 25.5 and rising from 17.5, with −DI at 39.3 far above +DI at 19.2. A strong trend is emerging and sellers control it. [Strong Trend – Bearish]
- Volume: 2.19M, modest compared with the big spikes from the earlier selloff. The Oct 30 gap down was not accompanied by capitulation-level volume, so the downside has not been exhausted. [Neutral / No capitulation]
DIVERGENCES & TRENDS
- CMF vs. price: CMF is positive (0.09) while price is making lower lows. This is a mild bullish divergence, but CMF has been fading and does not yet confirm a reversal.
- RSI: RSI made a slightly higher low (30.9) after the sharp drop, but it is still below 50 and has no confirmed bullish divergence against price.
- Trend structure: The chart shows a major downtrend from about $250 to $154. Price is below the SMA50D ($209.70) and SMA200D ($177.49), and SMA50D is well above SMA200D, so no death cross has formed yet, but it is likely if weakness persists.
- Crossovers: EMA13 crossed below EMA34, MACD crossed below its signal, and −DI crossed above +DI. All are bearish and fresh.
- VWAP: Price is slightly below VWAP ($155.32), which is mild intraday resistance.
- Gap: The Oct 30 open gapped from about $172 to $157, a sharp break of the $165–170 support zone, which is now resistance.
CHART PATTERNS
- The chart most resembles a Bearish Flag / Rising Wedge-type continuation pattern. The Oct 26–29 rally from about $149 to $183 was followed by a rejection and breakdown. That is a bounce within a larger downtrend that has now failed.
- A possible Double Bottom is forming near $147–150, with lows around Oct 22–26 and Oct 30. The neckline would be near $165–170, and confirmation needs a break above it, so this is only potential for now.
- Bearish measured move: a break below the $147–150 floor would open a drop toward about $140 or lower. A bullish double bottom would target about $165–170.
POTENTIAL SCENARIOS
- Scenario 1: Bearish Continuation Lower — Price stays below the falling EMAs and VWAP, and −DI dominance with a widening MACD gap pushes it to test and break the $147–150 support zone. Trigger: break below $150 and the lower Bollinger Band at $147.45. Target: $143–146. Invalidation: close above EMA13 at $160.50. (50% probability)
- Scenario 2: Neutral Consolidation / Oversold Bounce — The $147–150 double-bottom support holds, CMF stays positive, and price chops between $149 and $160. Trigger: holding $150 on closes. Target: $153–158. Invalidation: break below $147 or above $162. (30% probability)
- Scenario 3: Bullish Relief Rally — A bounce from the lower band reclaims VWAP and EMA13, with a short squeeze toward the EMA34. Trigger: close above $160.50 with rising volume. Target: $165–168. Invalidation: rejection at $160 and a drop back below $154. (20% probability)
PRICE TARGETS
For the 4-day timeframe, the range is guided by an ATR of $4.37, where a 4-day move is roughly 2 × ATR, plus the 4–8% range guidance.
- Target Price: $151.00
- Expected Range: $144.50 to $158.50 (width $14.00, about 9.1% of the current price, wide enough for a 4-day window given the elevated ATR and the gap-prone volatility)
- Key Levels: Support at $147.45, Resistance at $160.53
OVERALL BIAS
OVERALL BIAS: BEARISH - Price is below all key moving averages with fresh bearish EMA, MACD and DI crossovers, a rising ADX at 25.5 with −DI far above +DI, and no capitulation volume. The positive CMF and the $147–150 support zone could produce a bounce, but the evidence favors a drift lower.
This is educational analysis and not financial advice.