AMD 6-day bearish forecast — Nov 1, 2026
- Bias: Bearish
- Timeframe: 6 days (made Nov 1, 2026, target date Nov 6, 2026)
- Price at analysis: $505.18
- Price target: $497.00
- Expected range: $480.00 – $517.00
- Result: Correct (-11.3%) — closed at $447.99 on Nov 6, 2026; quality score 50/100
Get a free AI analysis of AMD today
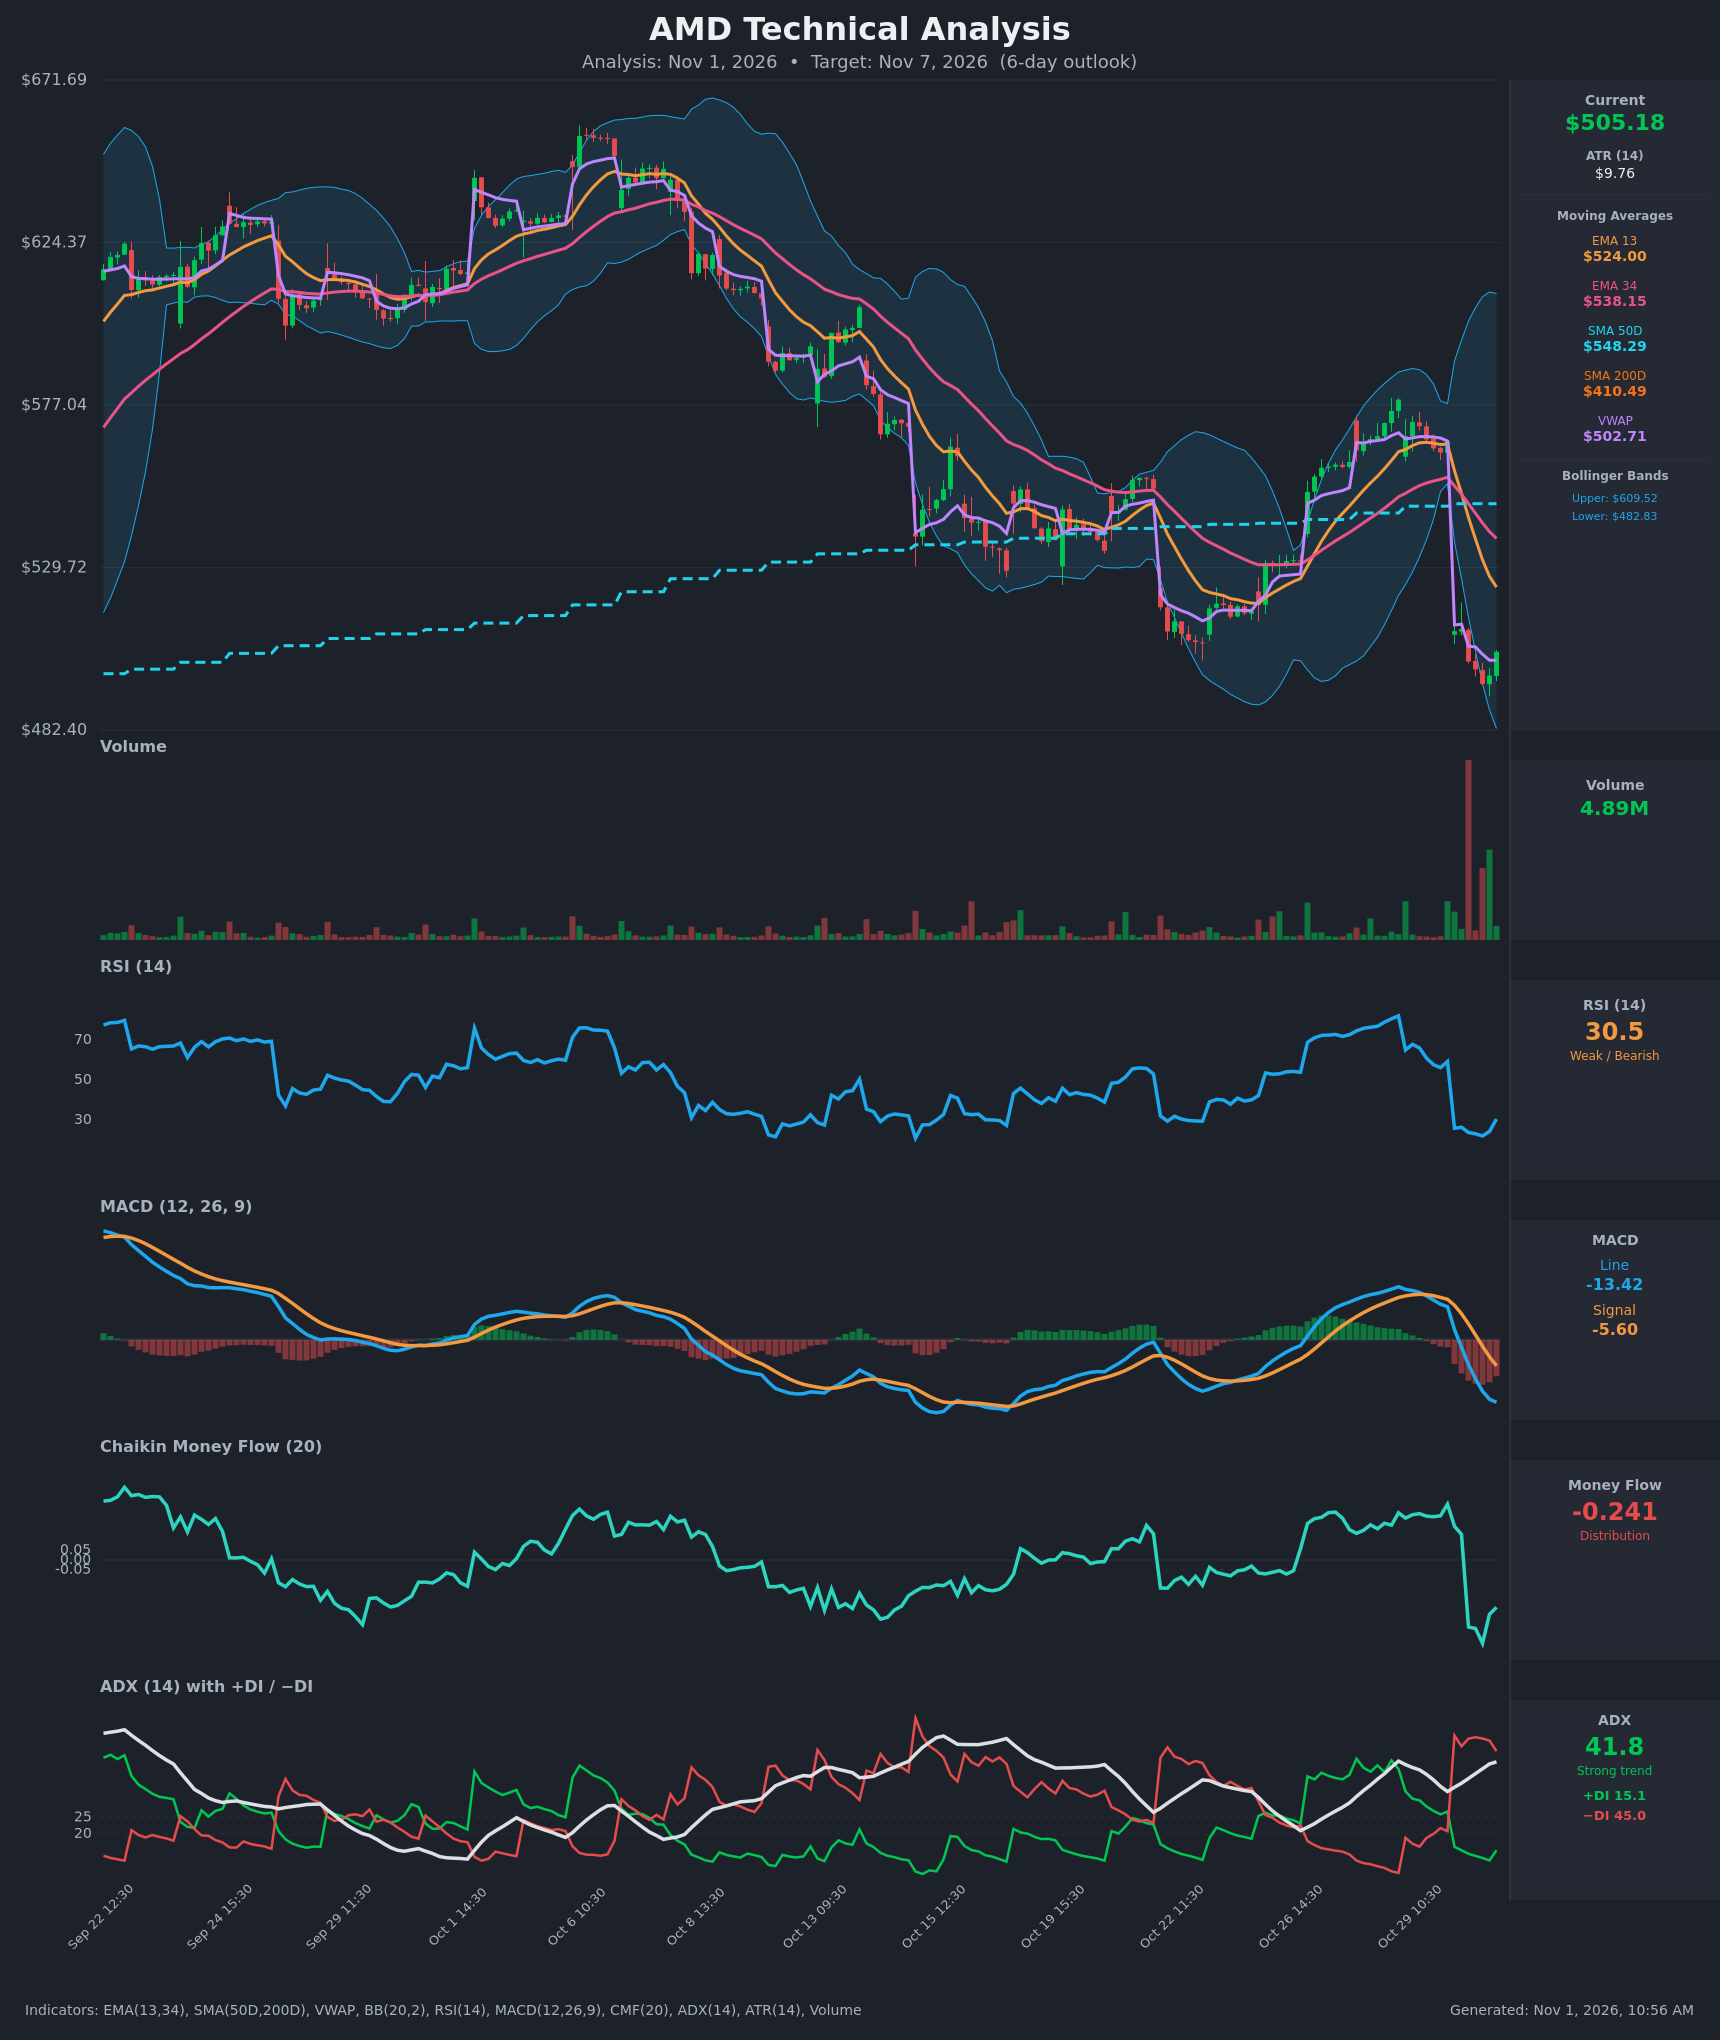
Analysis
TECHNICAL INDICATORS
- RSI (14): 30.46, bouncing from an extreme low of about 22 on Oct 30 after a collapse from 82 on Oct 28. It sits right at the oversold threshold. A bounce is starting, but RSI is still below 50 and under its prior swing lows. [Bearish]
- 20 EMA (EMA 13 / EMA 34 used): EMA 13 is $524.00 and EMA 34 is $538.15. Price at $505.18 is below both, and EMA 13 crossed below EMA 34 on Oct 30 around 11:30. Both averages are now overhead resistance and are sloping down. [Bearish]
- MACD: Line -13.42 is below Signal -5.60. The bearish crossover happened Oct 30 around 13:30, and the histogram is deeply negative and still expanding. Momentum is bearish, though the extension is large enough to raise the risk of a relief bounce. [Bearish]
- Bollinger Bands (20): Upper $609.52, lower $482.83. Price is in the lower quarter of the band, just above the lower band, after a gap-down from about $566 to $511. The bands are very wide because of the gap, so volatility is elevated. Price hugging the lower band signals a strong downtrend, but it also leaves room for a mean-reversion bounce. [Bearish]
- CMF (20): -0.241, well below -0.05. It collapsed from +0.28 to -0.42 and has recovered only slightly, so heavy distribution accompanied the gap-down. [Distribution]
- ADX (14): 41.8 and rising, with -DI at 45.0 far above +DI at 15.1. The bearish DI crossover happened Oct 30 at the open. This is a strong downtrend with bears firmly in control. [Strong Trend – Bearish]
- Volume: 4.89M on the latest bar. The chart shows a huge spike of selling volume on the gap-down bar, with follow-through volume above average afterward. Volume expanded on the breakdown, which confirms the selling, and the latest bar shows only modest buying volume. [Bearish confirmation]
Other moving-average context:
- SMA 50D: $548.29 is overhead, and price is below it.
- SMA 200D: $410.49 is far below, so the long-term uptrend is intact and the SMA 50D remains above the SMA 200D.
- VWAP: $502.71. Price is marginally above it, which is a slightly positive sign for the bounce.
DIVERGENCES & TRENDS
- There is no clear bullish RSI divergence yet. RSI made a low of about 22 while price made a low near $496, which is consistent rather than divergent. A divergence would only form if price makes a new low while RSI holds above 22.
- The trend in all momentum indicators is down. MACD is accelerating lower, ADX is rising, and −DI dominates.
- Crossovers this week are all bearish: EMA 13 below EMA 34, MACD below Signal, and −DI above +DI. Price also lost the SMA 50D and the EMA cluster.
- A death cross has not occurred, because the SMA 50D is far above the SMA 200D. This is a short-term breakdown inside a longer-term uptrend.
- Price is stabilizing around VWAP after the gap with a small uptick in RSI. This is the first sign of a relief bounce, but it has not yet reclaimed the EMA 13.
CHART PATTERNS
- Gap-down and bearish flag/pennant (tentative): After the Oct 30 gap, price is consolidating in a narrow range of roughly $496–$512. If this resolves lower, it is a bearish flag or pennant continuation. The measured move equals the pole, which is about $55 and would point far lower. The sample is too small to rely on.
- Broader structure: Since the Oct 6 peak near $660, price has made lower highs ($650, then $580, then $578). This resembles a Bearish Head and Shoulders or rounded top, with the latest gap-down breaking the prior swing-low support near $520. The Oct 22 low near $520 has become resistance.
- Counter-view: An oversold bounce toward the gap and the EMA 13 at about $524 is typical before the next leg lower. It would not invalidate the bearish structure unless price reclaims about $538.
POTENTIAL SCENARIOS
- Scenario 1: Bearish Continuation Lower — After a brief bounce fails, price rolls over under the EMA 13 and resumes the downtrend, with −DI dominant and ADX above 40. Trigger: a break below the post-gap low near $496 and the lower Bollinger Band at $482.83. Target: $485–$490, with a stretch toward $480. Invalidation: a daily/hourly close above $524 (EMA 13). (50% probability)
- Scenario 2: Bullish Oversold Relief Bounce — RSI near 30, price at the lower band, and price holding above VWAP trigger a mean-reversion bounce that partially fills the gap. Trigger: a push above $512 with rising volume. Target: $524 (EMA 13), then $538 (EMA 34). Invalidation: loss of $496 and VWAP at $502.71. (35% probability)
- Scenario 3: Neutral Post-Gap Base — Price chops between about $496 and $520 as the selling exhausts without a decisive bounce. Trigger: ADX rolling over and RSI stabilizing in the 35–45 range. Target: $500–$515. Invalidation: a break outside $490–$524. (15% probability)
PRICE TARGETS
For a 6-day timeframe, I used a range width of about 7% of current price. ATR (14) on these hourly bars is $9.76, and the range allows for roughly 2–3 ATRs of movement in each direction. Width is $37, or about 7.3% of the current price.
- Target Price: $497.00 (6 days)
- Expected Range: $480.00 to $517.00
- Key Levels: Support at $482.83 (lower Bollinger Band), Resistance at $524.00 (EMA 13)
OVERALL BIAS
OVERALL BIAS: BEARISH - The Oct 30 gap-down confirmed by heavy volume, a MACD bearish crossover, −DI at 45 against +DI at 15 with ADX near 42, deeply negative CMF, and price below all short-term EMAs outweigh the oversold RSI. A relief bounce toward $524 is possible, but the path of least resistance remains lower.
This is educational analysis and not financial advice.