AMD 27-day bearish forecast — Nov 15, 2026
- Bias: Bearish
- Timeframe: 27 days (made Nov 15, 2026, target date Dec 11, 2026)
- Price at analysis: $534.06
- Price target: $515.00
- Expected range: $470.00 – $562.00
- Result: Pending — graded after the close on Dec 11, 2026
Get a free AI analysis of AMD today
Analysis
TECHNICAL INDICATORS
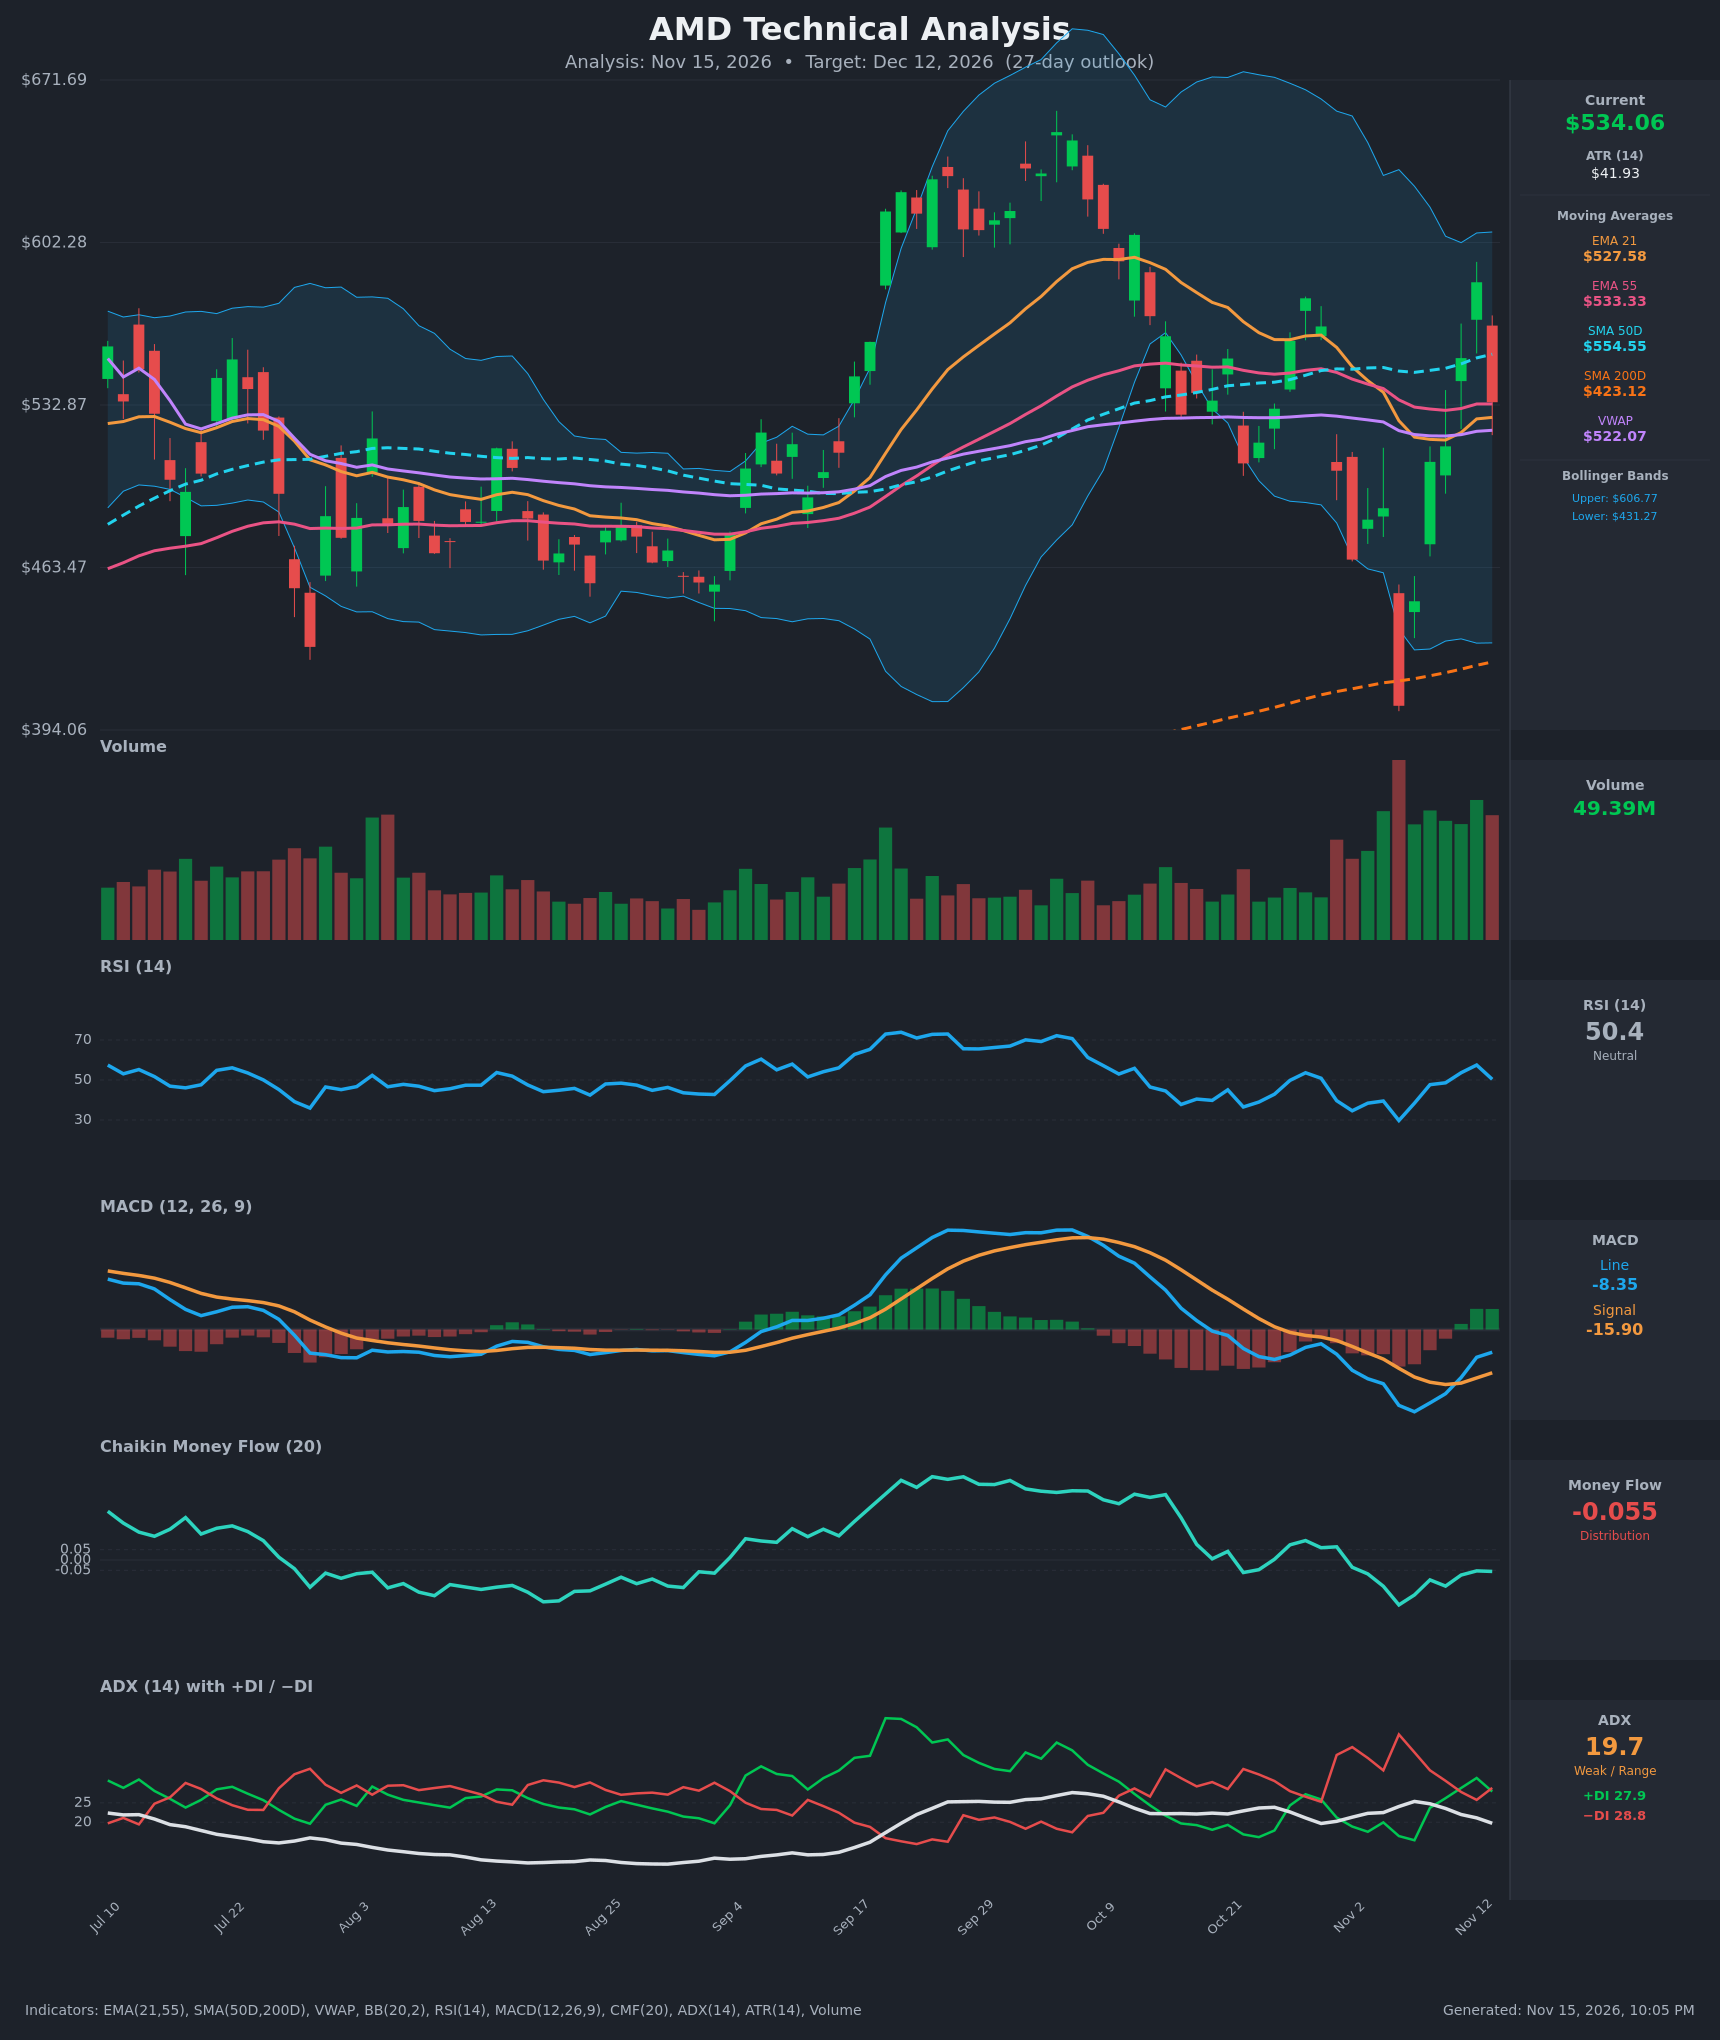
- RSI (14): 50.36, dead neutral. It fell from 57.5 to 50.4 in one session after bouncing off 29.7 on Nov 5. The recovery from oversold has stalled at the midline. [Neutral]
- 20 EMA: The 21 EMA is $527.58 and price ($534.06) sits just above it, but the Nov 13 close gave back most of the prior day's gains. EMA21 (527.58) and EMA55 (533.33) are nearly flat and tangled with price, so there is no clean trend support or resistance. [Neutral]
- MACD: The line (-8.35) crossed above the signal (-15.90) on Nov 11, and the histogram is positive at about +7.5. However, both lines are still below zero, and the line ticked down on the last bar (-10.2 to -8.3). This is a bullish crossover inside a broader bearish-zone reading. [Bullish]
- Bollinger Bands (20): Upper is $606.77 and lower is $431.27, so the bands are very wide, reflecting extreme volatility (the 404 to 585 swing). Price is near the midline (about $519), so there is no band-edge edge. The Nov 12 high of $585 stalled before the upper band. [Neutral]
- CMF (20): -0.055, just under the -0.05 threshold. It has been negative since Nov 2 and is improving only slowly from -0.217. This is mild distribution. [Distribution]
- ADX (14): 19.7 and falling, so there is no meaningful trend. +DI is 27.9 and -DI is 28.8, a marginal bearish tilt after +DI had crossed above on Nov 11-12. [Weak Trend, slight bearish tilt]
- Volume: 49.39M on the latest bar, one of the heaviest sessions in the window. It was a red candle that erased the prior day's rally (585 to 534, about -8.8%). That is high-volume rejection near resistance. [Bearish]
DIVERGENCES & TRENDS
- Price structure: Highs are descending, from about $666 in late Sep to $600 in mid-Oct to $585 on Nov 12. This is a lower-high sequence.
- No major RSI or MACD divergence. The MACD histogram turned positive while price made a lower high and then reversed, which makes the MACD bounce look fragile.
- Moving averages: SMA50 ($554.55) is flat to slightly rising and acts as overhead resistance. SMA200 ($423.12) is rising, so the long-term trend is still up and price is about 26% above it. No golden or death cross is pending.
- Crossovers: The MACD bullish cross (Nov 11) is the only fresh bullish trigger. The DI lines re-crossed back to -DI on top on Nov 13, and CMF is back at -0.055.
- Volatility: ATR is $41.93 (about 7.9% of price), so daily swings are large.
CHART PATTERNS
- Bearish Rising Wedge / lower-high structure (loose fit): The rebound from $404 into $585 formed a sharp, rising leg that failed beneath the SMA50 and the prior breakdown zone. If this is a failed relief rally, the measured retest is the $466-$505 zone, and a break below $404 would be a larger breakdown.
- Symmetrical Triangle (weak fit): The shrinking ADX and the converging EMA/VWAP cluster hint at compression, but the swings are too wide for a clean triangle.
- Context: Price remains in a broad, volatile range of $404 to $585, with the SMA200 far below. A high-volume rejection candle at the top of the recent bounce tilts the near-term edge to the downside.
POTENTIAL SCENARIOS
- Scenario 1: Bearish Failed Relief Rally — The Nov 13 rejection on heavy volume continues as sellers defend the SMA50 and the lower-high structure. Price loses the EMA21/VWAP cluster and drifts lower. Trigger: daily close below $522 (VWAP) and then below $505. Target: $490 to $505, with an extension to $470. Invalidation: daily close above $555 (SMA50). (45% probability)
- Scenario 2: Bullish Reclaim and Breakout — The MACD cross and the long-term uptrend above SMA200 carry through. Buyers reclaim the SMA50 and retest the Nov 12 high. Trigger: close above $555 with CMF back above +0.05. Target: $585 to $600. Invalidation: close below $505. (35% probability)
- Scenario 3: Neutral Chop — Weak ADX keeps price pinned between the EMAs and the SMA50. Trigger: closes between $505 and $555. Target: $515 to $540. Invalidation: close outside $490 to $570. (20% probability)
PRICE TARGETS
- Target Price: $515.00 (27-day, about -3.6% from current)
- Expected Range: $470.00 to $562.00 (width $92, about 17.2% of price, in line with the 12-18% guidance for 30-60 days scaled to 27 days)
- Key Levels: Support at $505.00 (Oct 30 close area / lower swing cluster), Resistance at $554.55 (SMA50)
OVERALL BIAS
OVERALL BIAS: BEARISH - A high-volume reversal candle (585 to 534) after a failed lower-high rally, -DI above +DI, mild CMF distribution, and price sitting under the SMA50 outweigh the early MACD crossover. Conviction is modest because ADX is weak and the long-term trend above the SMA200 is still intact.
This is educational analysis and not financial advice.