AMD 48-day bullish forecast — Nov 15, 2026
- Bias: Bullish
- Timeframe: 48 days (made Nov 15, 2026, target date Jan 1, 2027)
- Price at analysis: $534.06
- Price target: $558.00
- Expected range: $488.00 – $578.00
- Result: Pending — graded after the close on Jan 1, 2027
Get a free AI analysis of AMD today
Analysis
TECHNICAL INDICATORS
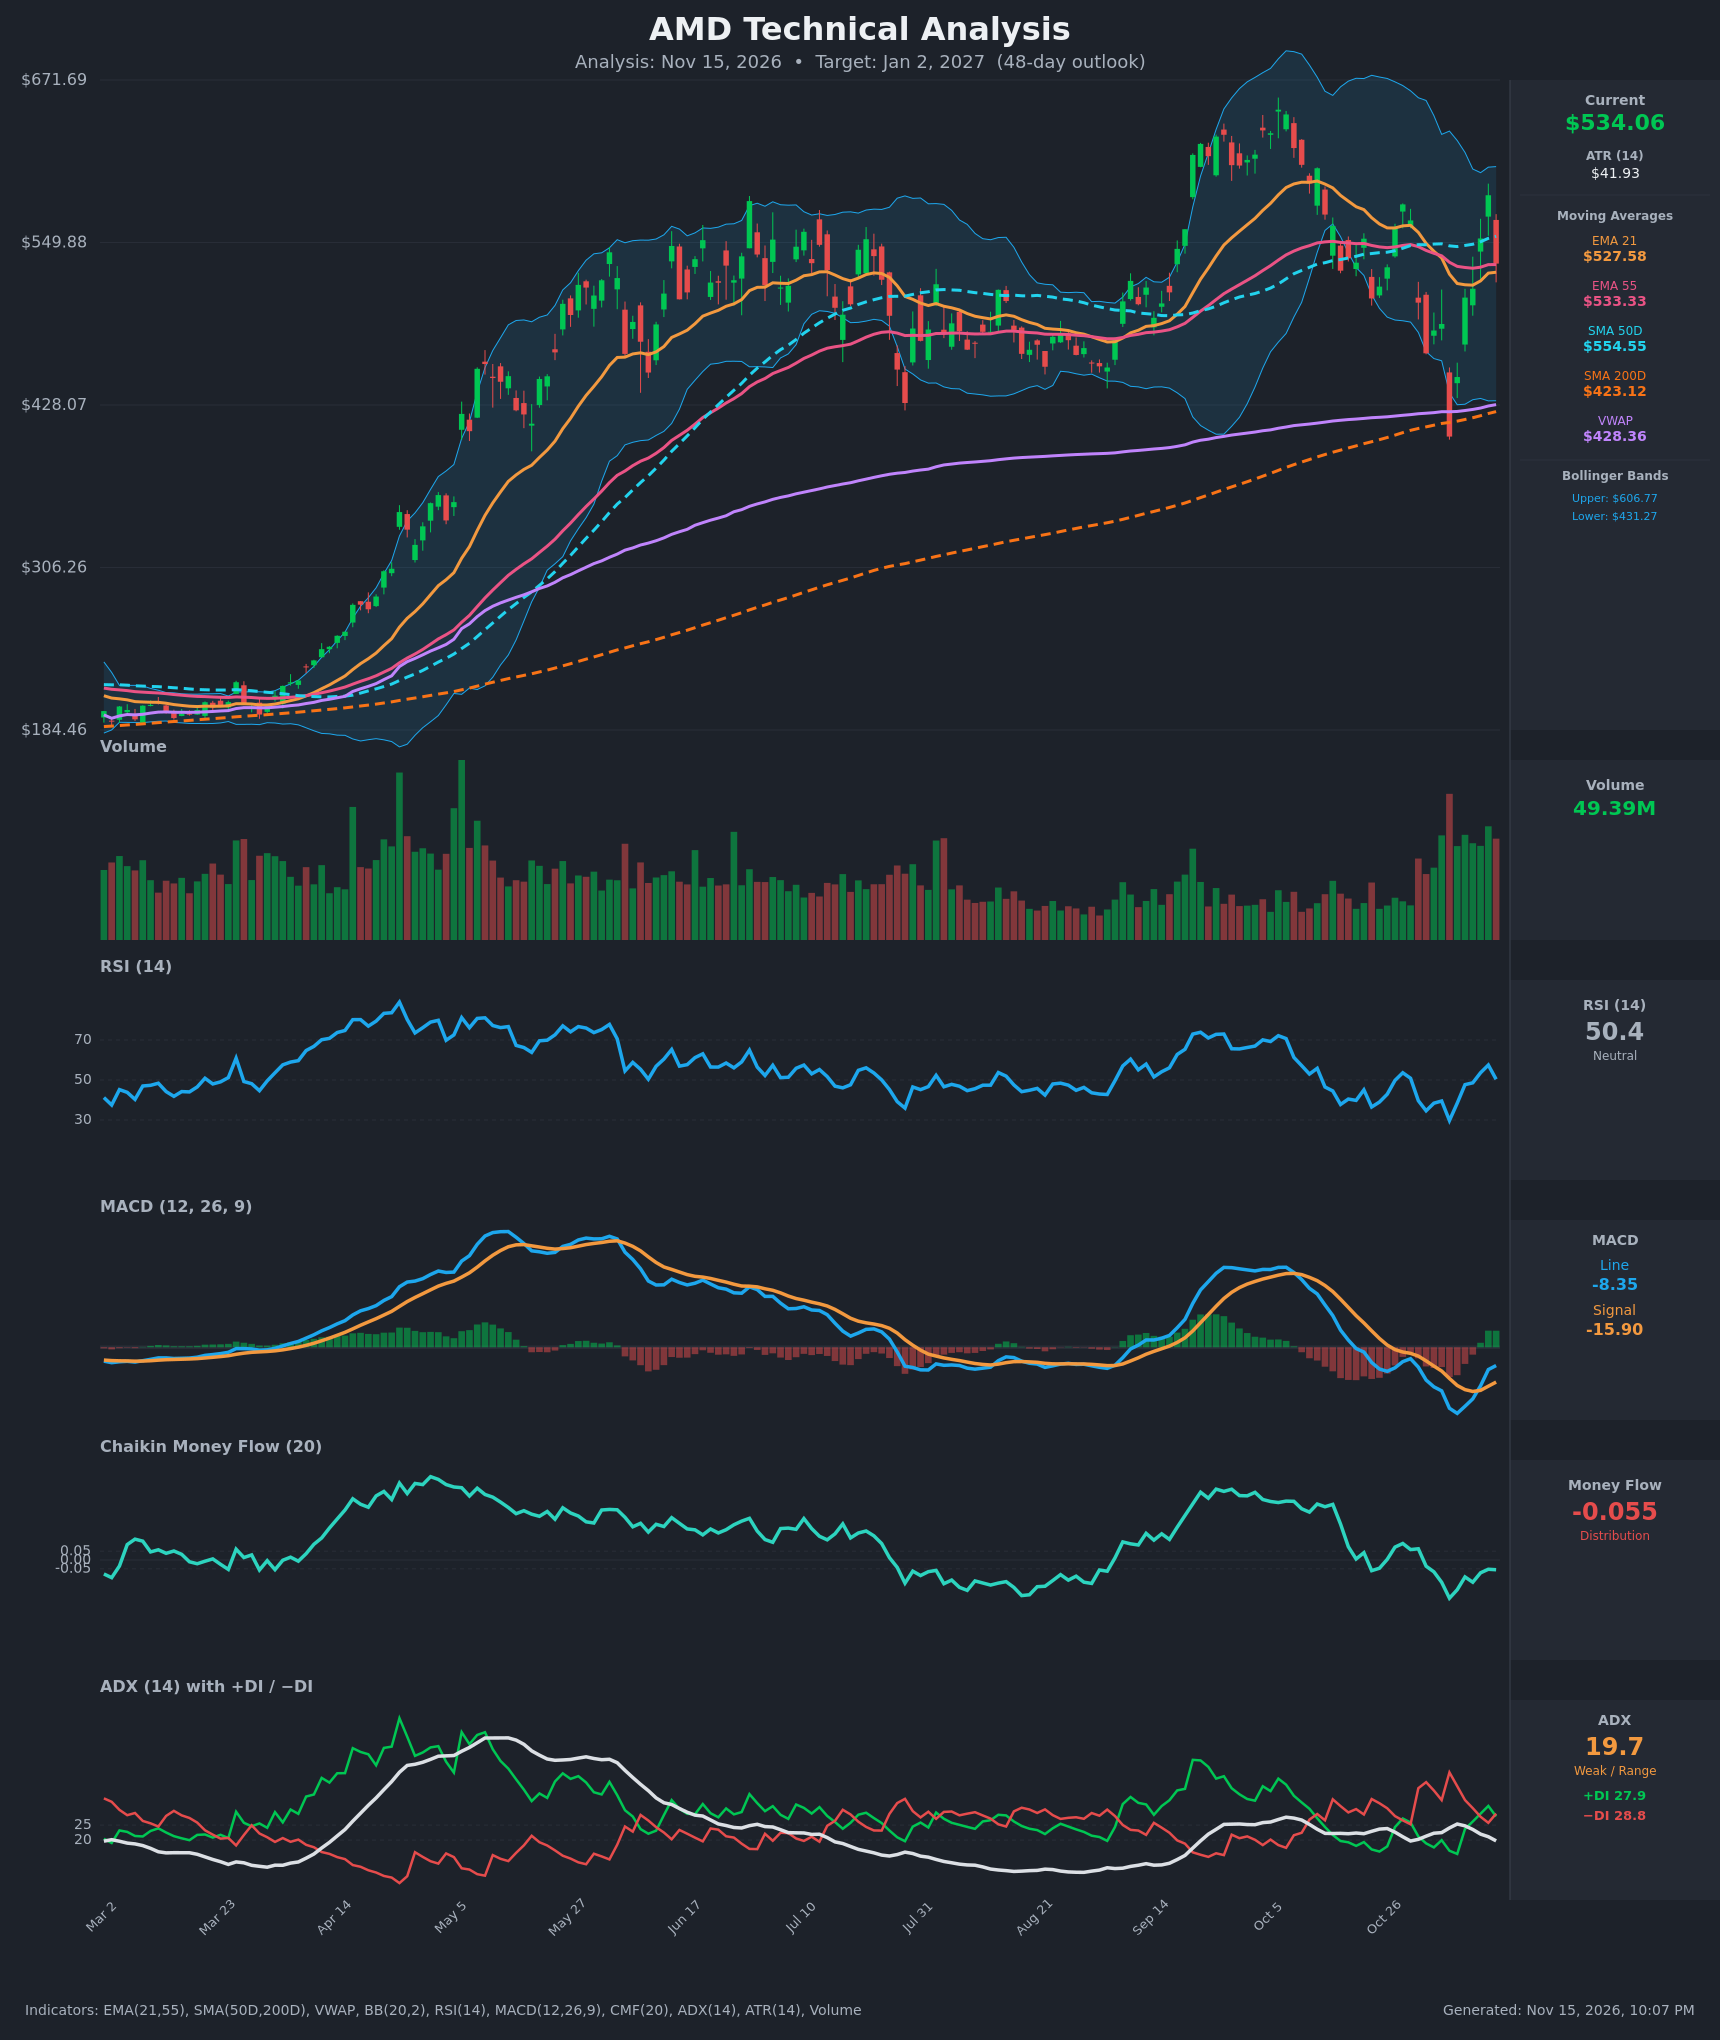
- RSI (14): 50.36, dead neutral. It bounced from a 29.7 oversold low on Nov 5 to 57.5 on Nov 12, then pulled back as price dropped on Nov 13. Momentum has recovered but stalled at the midline. [Neutral]
- 20 EMA: EMA 21 is $527.58 and price ($534.06) is just above it, so it acts as first support. EMA 21 is rising again after bottoming near $518, and it sits just below EMA 55 ($533.33), so no bullish crossover has occurred yet. The 50-day SMA ($554.55) is overhead resistance. [Neutral]
- MACD: Line -8.35, signal -15.90, histogram about +7.5. The line crossed above the signal on Nov 11, a bullish crossover from deeply negative territory. Both lines are still below zero and the histogram flattened on the last bar, so this is a recovery, not yet a trend change. [Bullish]
- Bollinger Bands (20): Upper $606.77, lower $431.27, midline about $519. Price sits slightly above the midline, with the bands wide after the Nov 5 selloff to $404. The Nov 12 close ($585) failed to reach the upper band and was rejected. Wide bands mean high volatility, not a directional signal. [Neutral]
- CMF (20): -0.055, just under the -0.05 threshold. It has been negative since Oct 30 and has not turned positive during the rebound, so buying is not confirming the bounce. [Distribution]
- ADX (14): 19.7, below 20, so the trend is weak or range-bound. −DI (28.8) is barely above +DI (27.9), after +DI led on Nov 12 (31.4 vs 25.8). Neither side has control. [Weak Trend, slightly bearish]
- Volume: 49.39M, elevated against the quiet summer base. The heaviest bars were the Nov 5 capitulation and the recent swings. Nov 13 was a heavy red candle (-8.8%) that reversed most of the prior two days' gains, so there is supply near $585. [Heavy, two-sided volatility; cautious]
DIVERGENCES & TRENDS
- Long-term trend: Price is far above the 200-day SMA ($423.12), and the 50-day SMA ($554.55) is well above it with no death cross. The structural uptrend is intact. The Nov 5 flush to $404 was held at the 200-day SMA and VWAP (about $423–428).
- Moving averages: Price is below the 50-day SMA, which has been flat to slightly rising since Nov 9 and is the main overhead hurdle. EMA 21 and EMA 55 are converging at about $528–533, so a bullish or bearish cross is imminent.
- Divergences: No clean divergence. RSI's higher low (29.7 → 50) matches the price recovery. CMF is making lower highs and is negative while price bounced, a mild negative divergence in volume flow.
- Crossovers: MACD turned bullish on Nov 11. The DI lines have flipped back and forth in a tight band, a sign of chop. ADX is falling below 20, which confirms indecision.
- Rejection: The Nov 13 bearish candle from $585 to $534 is the main near-term negative. It leaves price testing the EMA 21 and EMA 55 cluster.
CHART PATTERNS
- Broad consolidation / expanding range: Since mid-September, swings have widened from roughly $470–$650 to a $404–$585 range. This resembles the Bearish Expanding Triangle in the diagram. It is only loosely formed and is not a confirmed reversal.
- Possible Double Top: Highs of about $578 (Oct 28) and $585 (Nov 12) form a near-double top. The neckline is far below at about $404 (the 200-day SMA zone), so the measured-move target is distant and the pattern is not triggered.
- V-shaped recovery from the 200-day SMA: The $404 low held exactly at long-term support. This is a constructive higher-timeframe base, though not a textbook Double Bottom.
- Significance: With ADX under 20, the pattern evidence is mostly range-bound. The key decision levels are $585 (breakout) and $450–$404 (breakdown).
POTENTIAL SCENARIOS
- Scenario 1: Bullish Recovery Toward Range Highs — The MACD bullish crossover, the held 200-day SMA and the long-term uptrend support a grind higher. Price holds the EMA 21/55 cluster and reclaims the 50-day SMA. Trigger: daily close above $554.55 with CMF turning positive. Target: $580–$585, with a stretch toward $600. Invalidation: daily close below $505. (45% probability)
- Scenario 2: Bearish Rejection and Retest of Lows — The Nov 13 rejection near $585, negative CMF, −DI above +DI and the possible double top lead to renewed selling. Trigger: close below $505–$508 and loss of the EMA 21/55 cluster. Target: $450, then $425–$430 (the 200-day SMA and VWAP). Invalidation: close above $585. (30% probability)
- Scenario 3: Neutral Range Chop — ADX stays below 20 and price oscillates between $490 and $580 around the moving-average cluster. Trigger: failure to close beyond $554 or $505. Target: $515–$545. Invalidation: close outside $485–$590. (25% probability)
PRICE TARGETS
- Target Price: $558.00 (48-day horizon, around Jan 2, 2027)
- Expected Range: $488.00 to $578.00 (width $90, about 16.9% of the current price; this fits the 30–60 day guidance of 12–18%)
- Key Levels: Support at $505.00 (the Oct 30 and Nov 9–10 consolidation zone, just below the EMA 21/55 cluster at about $528–533), Resistance at $554.55 (50-day SMA, then $585)
OVERALL BIAS
OVERALL BIAS: BULLISH - The 200-day SMA held on the capitulation low, price is back above EMA 21 and EMA 55, MACD has crossed up and the long-term uptrend is intact. The conviction is modest because CMF is negative, ADX is weak, the Nov 13 rejection came on heavy volume, and the 50-day SMA is overhead resistance.
This is educational analysis and not financial advice.