AMD 83-day bullish forecast — Nov 15, 2026
- Bias: Bullish
- Timeframe: 83 days (made Nov 15, 2026, target date Feb 5, 2027)
- Price at analysis: $534.06
- Price target: $565.00
- Expected range: $470.00 – $620.00
- Result: Pending — graded after the close on Feb 5, 2027
Get a free AI analysis of AMD today
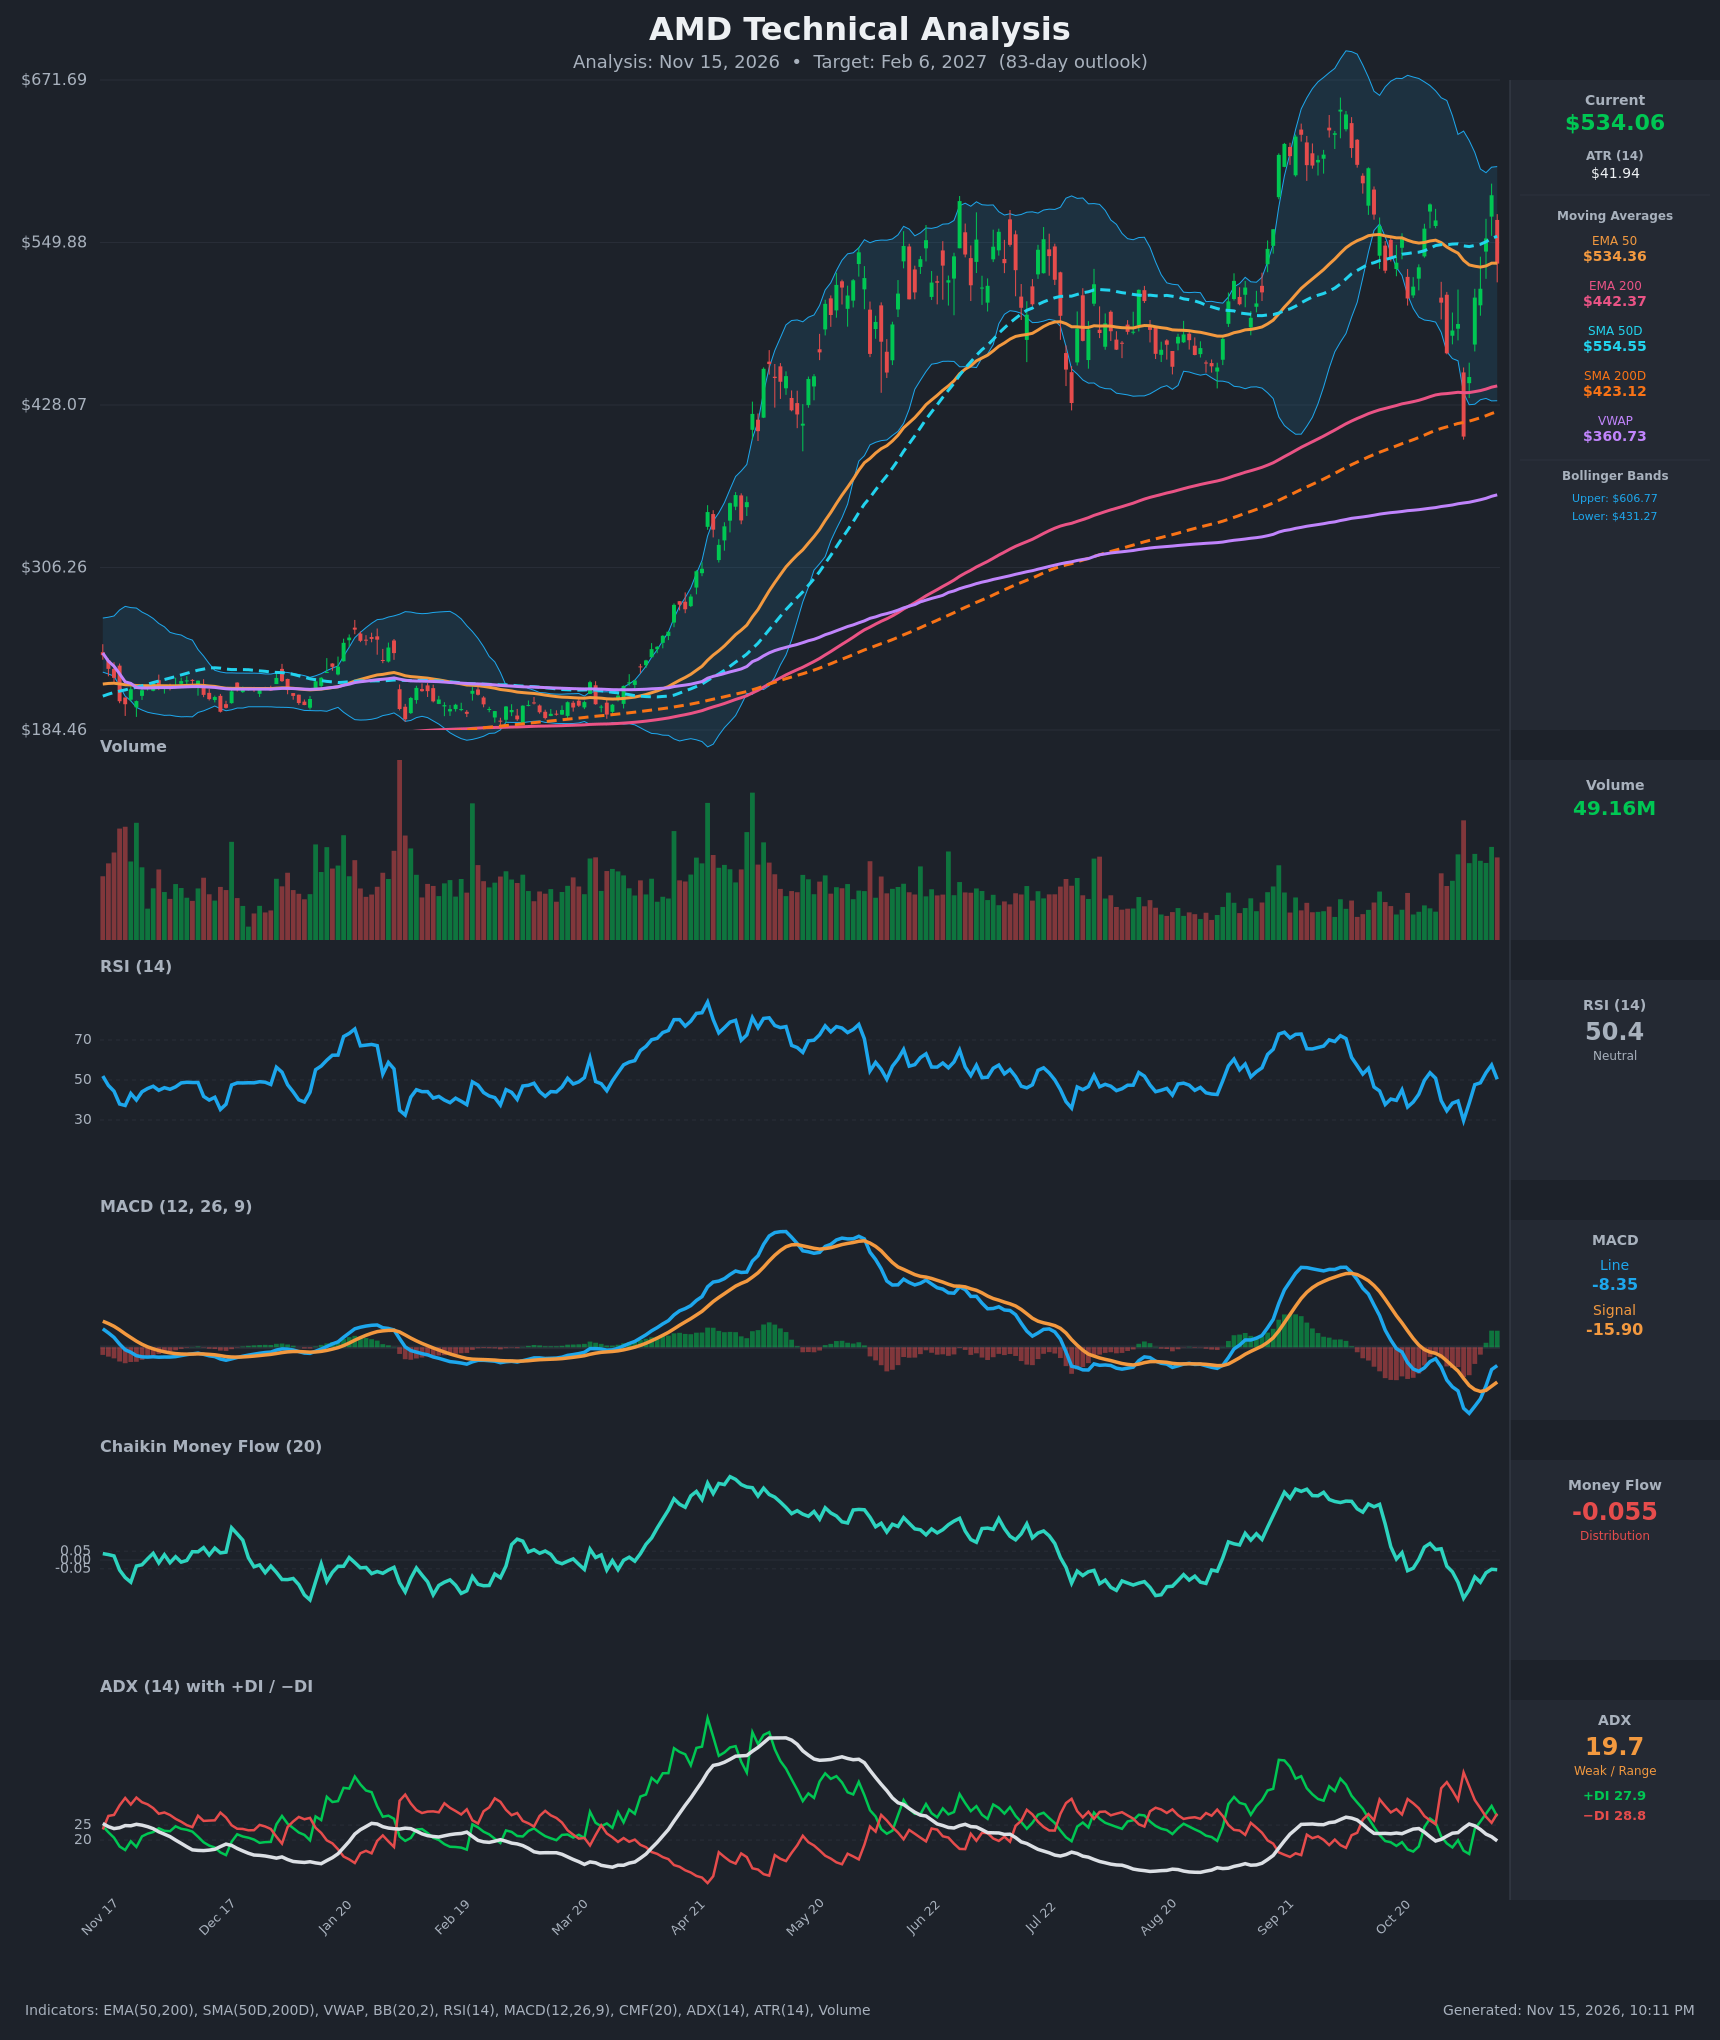
Analysis
TECHNICAL INDICATORS
- RSI (14): 50.36, dead neutral. It has recovered from oversold at 29.7 (Nov 5) and peaked at 57.5 on Nov 12, then slipped back on the -8.8% drop. Momentum is recovering but stalled at the midline. [Neutral]
- 20 EMA: No 20 EMA is supplied, so I use the EMA 50 at $534.36. Price ($534.06) sits right on it, and the EMA has flattened after rolling over from $551. The SMA 50 at $554.55 is overhead resistance, while EMA 200 ($442.37) and SMA 200 ($423.12) are rising far below as long-term support. [Neutral]
- MACD: Line -8.35 is above signal -15.90, so the histogram is +7.5. The bullish crossover came on Nov 11, but both lines are still below zero, and the line ticked down on the last bar (-10.2 to -8.35). This is a recovery from a deep bearish trough, not yet a confirmed trend change. [Bullish]
- Bollinger Bands (20): Upper $606.77, lower $431.27, midline about $519. Price is just above the midline in the middle of a wide band. The bands are wide (about 33% of price), which reflects very high volatility. The Nov 5 flush to $404 pierced the lower band and was bought back. [Neutral]
- CMF (20): -0.055, just past the distribution threshold. It has been negative since Nov 2 and is improving from -0.217, but it has not turned positive. Selling pressure is mild and fading. [Distribution]
- ADX (14): 19.7 and falling, so the trend is weak or range-bound. +DI (27.9) is just below -DI (28.8) after the bulls briefly led on Nov 12. The DIs are nearly equal, so neither side is in control. [Weak Trend, direction neutral]
- Volume: 49.16M on a down day. Volume has been elevated across the last two weeks, with a spike on the Nov 5 capitulation low. Heavy volume on the reversal from $404 suggests buyers defended the 200-day MAs. The latest red bar shows supply near $585. [Mixed, slight support at lows]
DIVERGENCES & TRENDS
- MACD / RSI vs. price: The Nov 5 low of $404 came with RSI at 29.7 and MACD at -27.9. Price has since recovered about 32%, and MACD has crossed up from its trough. This is a classic momentum recovery.
- Lower highs in momentum: RSI peaked near 72 in Sep-Oct and only reached 57.5 on the latest bounce. The medium-term momentum high is lower, and the price high of about $585 sits below the September peak near $650.
- MA structure: There is no fresh golden or death cross. The SMA 50 ($554.55) is well above the SMA 200 ($423.12), and the EMA 50 is above the EMA 200. The long-term uptrend is intact. Price is above both 200s but only at the EMA 50, below the SMA 50.
- CMF and ADX: CMF has not confirmed the price bounce and is still slightly negative. ADX at 19.7 shows no directional trend, which fits a broad range of about $404-$650.
- Crossover: MACD crossed bullishly on Nov 11, and the +DI/-DI lines have crossed back and forth in the last few bars, which signals indecision.
CHART PATTERNS
- Bullish Double Bottom (loose): The July low of about $420 and the Nov 5 low of $404 are both held at the 200-day MAs. The neckline is around $585-$600. A confirmed break would give a measured move of roughly $620-$650.
- Bearish Double Top / lower-high risk: The September peak (about $650) and the October-November high ($585) form a lower high. Failure at $585 and a break of $484 would point to a retest of the 200-day MAs ($423-$442).
- Broad range (loosely, a symmetrical or expanding triangle): Since May, price has swung between roughly $404 and $650 with weak ADX. Resolution is likely to come from the MAs below or the $585-$650 supply zone above.
- Targets: Bullish is $600-$620 on a neckline break. Bearish is $440-$450 (EMA 200) on a break of $484.
POTENTIAL SCENARIOS
- Scenario 1: Bullish Double-Bottom Recovery — The 200-day MAs hold, the MACD crossover extends above zero, and CMF turns positive. Price reclaims the SMA 50 and challenges the $585 swing high. Trigger: close above $555 (SMA 50), then above $585. Target: $590-$620. Invalidation: close below $484. (45% probability)
- Scenario 2: Bearish Lower-High Rollover — The Nov 13 rejection near $585 marks a lower high. The MACD stalls below zero, -DI regains control, and CMF stays in distribution. Trigger: daily close below $484, then below $466. Target: $440-$450 (EMA 200), with extension to $425. Invalidation: close above $585. (30% probability)
- Scenario 3: Neutral Range Chop — Weak ADX keeps price between the 200-day MAs and $585. Trigger: failure to close above $555 or below $485. Target: $500-$550. Invalidation: a break of either $484 or $585. (25% probability)
PRICE TARGETS
Timeframe: 83 days (Feb 6, 2027). The range is $150 wide, about 28% of the current price, in line with the 18-30% guidance for 61-180 days. This is consistent with ATR at about 8% of price.
- Target Price: $565.00
- Expected Range: $470.00 to $620.00
- Key Levels: Support at $485.00, Resistance at $585.30 (the SMA 50 at $554.55 is the first hurdle)
OVERALL BIAS
OVERALL BIAS: BULLISH - The long-term uptrend is intact with price above rising 200-day averages, and the double-bottom-like holds at $404-$420 came with a bullish MACD crossover. The edge is modest because ADX is weak, CMF is slightly negative, and the $585 lower-high zone must be cleared.
This is educational analysis and not financial advice.