AMD 62-day bullish forecast — Nov 15, 2026
- Bias: Bullish
- Timeframe: 62 days (made Nov 15, 2026, target date Jan 15, 2027)
- Price at analysis: $534.06
- Price target: $565.00
- Expected range: $480.00 – $615.00
- Result: Pending — graded after the close on Jan 15, 2027
Get a free AI analysis of AMD today
Analysis
TECHNICAL INDICATORS
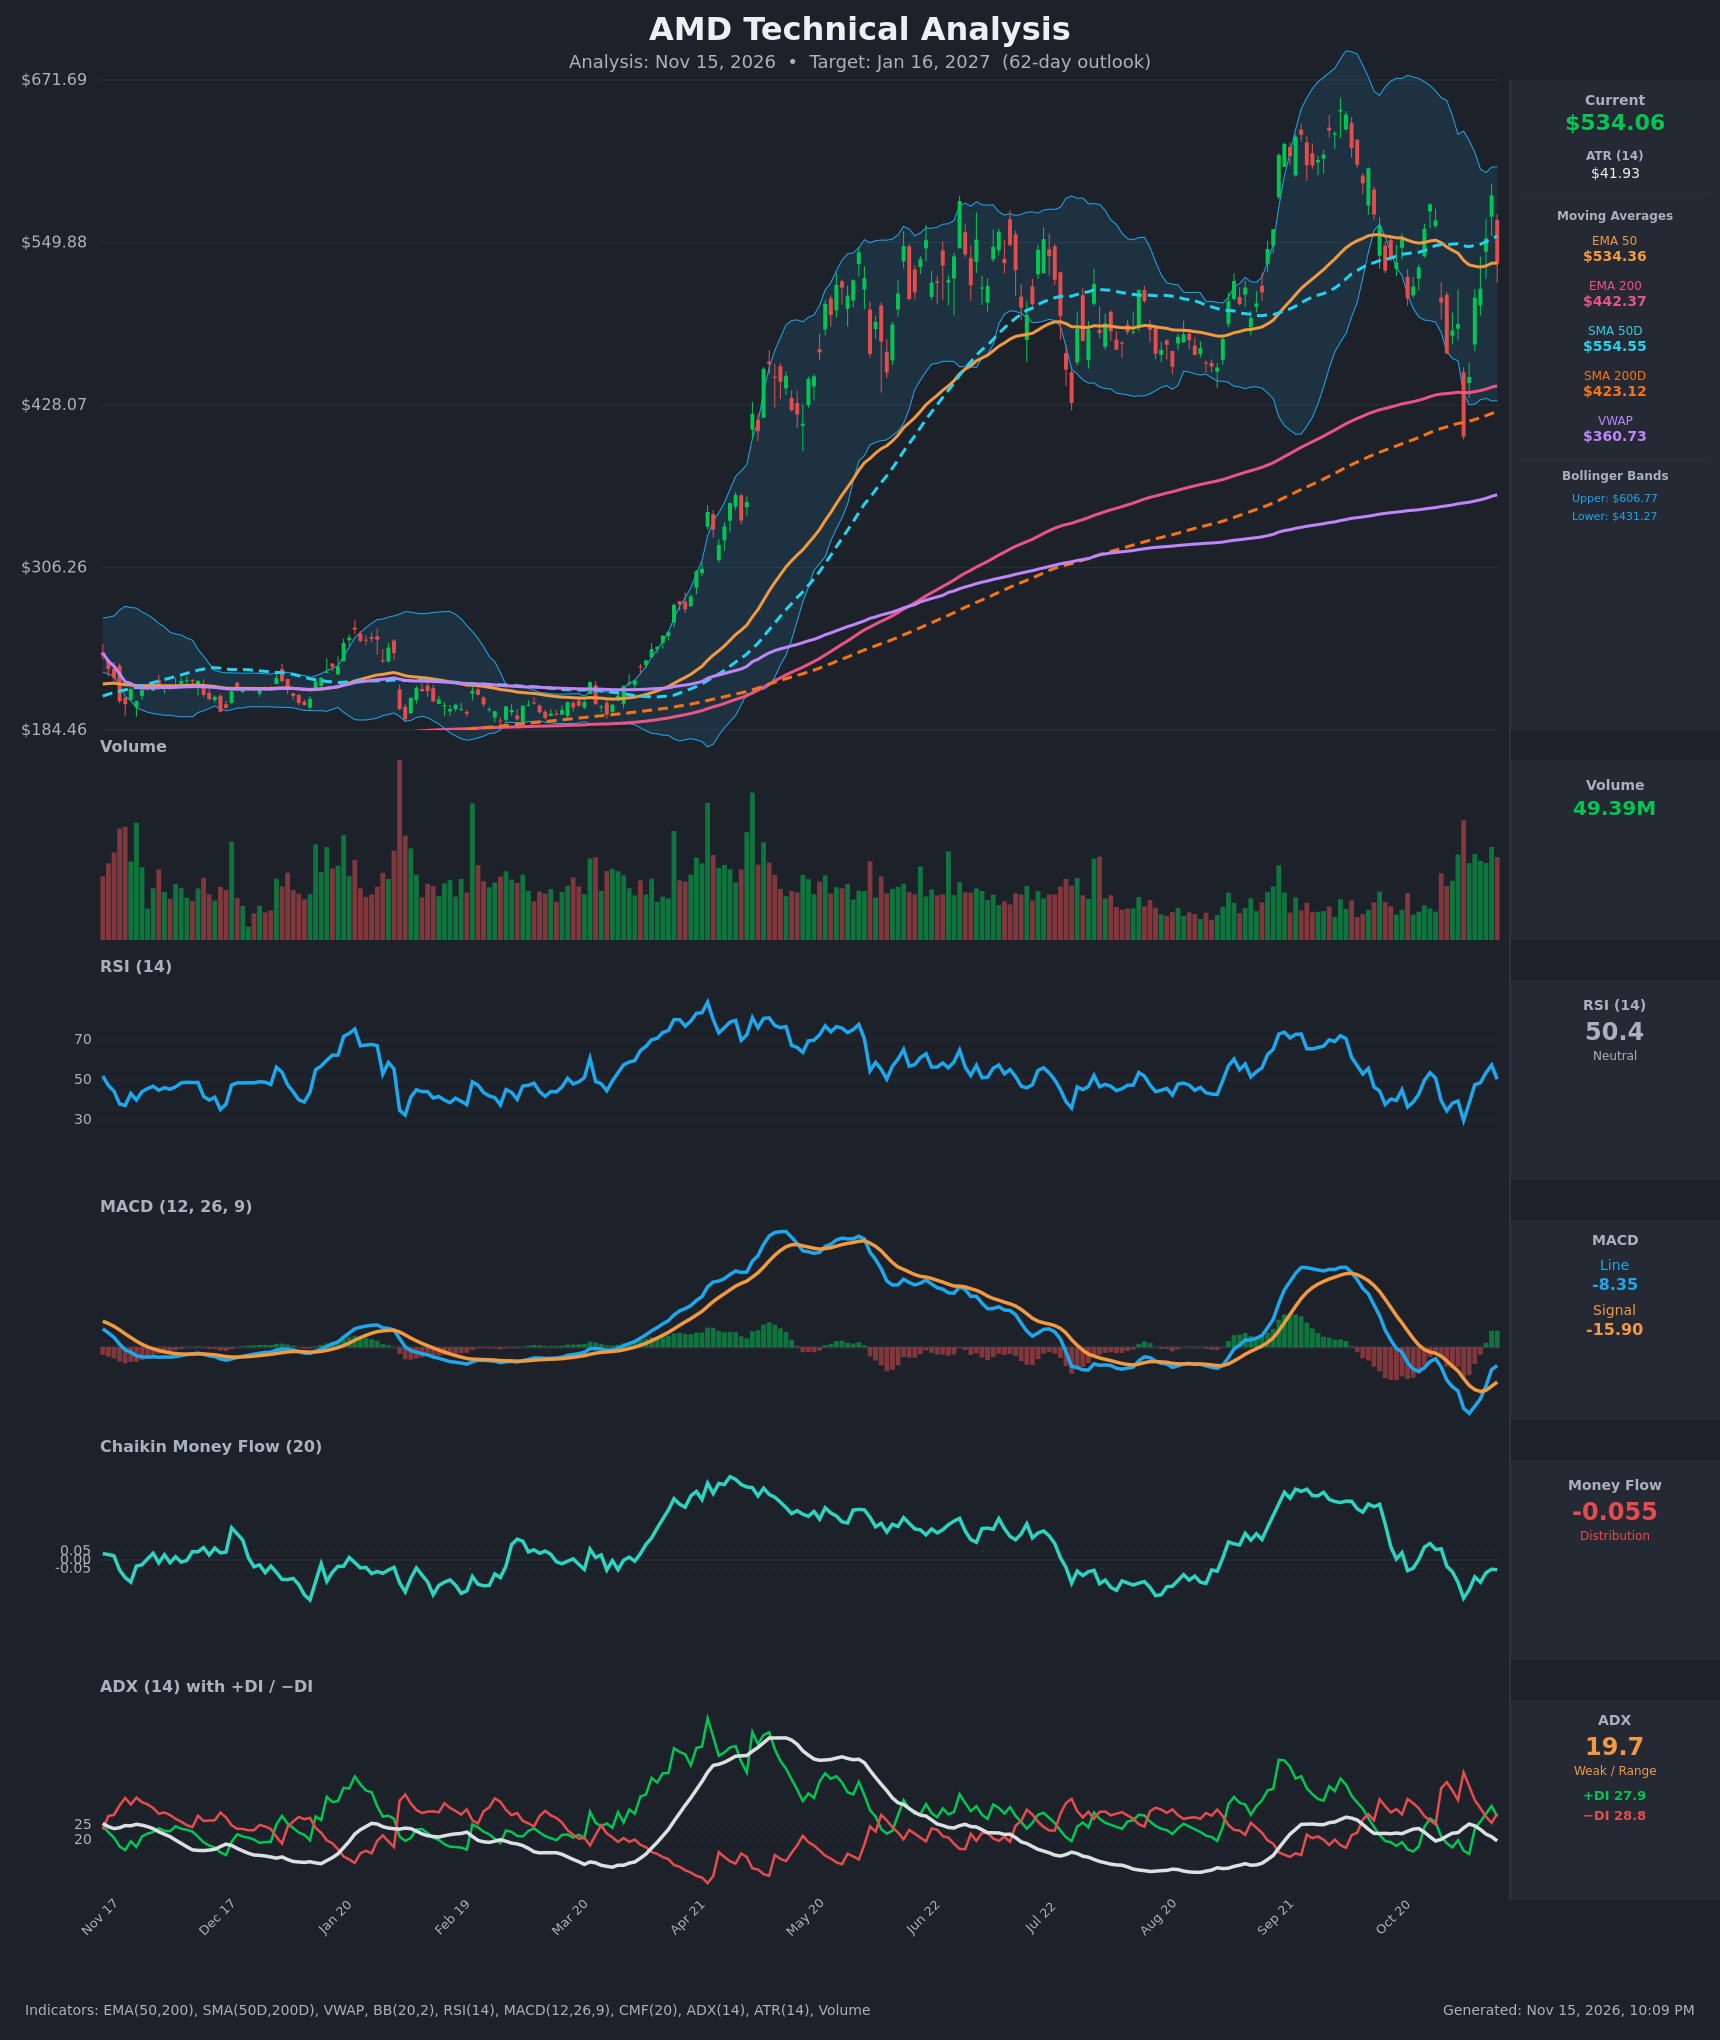
- RSI (14): 50.36, dead neutral. It has recovered from an oversold 29.7 on Nov 5 and peaked at 57.5 on Nov 12, but the Nov 13 drop pulled it back to 50. Momentum is stalling at the midline. [Neutral]
- 20 EMA: No 20 EMA is supplied, so I use the EMA 50 at $534.36 as the nearest dynamic average. Price ($534.06) sits exactly on it, so it is acting as a pivot. Price is below the SMA50D ($554.55), which is overhead resistance. It is well above the EMA200 ($442.37) and SMA200D ($423.12). [Neutral]
- MACD: The line (-8.35) crossed above the signal (-15.90) on Nov 11, and the histogram is positive at about +7.5. Both lines are still below zero, and the line is flattening after the Nov 12 reading of -10.2. This is a bullish crossover from deeply negative territory, so it is an early recovery signal rather than a confirmed uptrend. [Bullish]
- Bollinger Bands (20): Upper $606.77, lower $431.27, midline about $519. Price is slightly above the midline, and the bands are wide (about 33% of price) after the volatile Nov 5 flush to $404. Price tagged the lower band during the selloff and bounced. It was rejected from the upper half at $585, and it is now back near the middle. [Neutral]
- CMF (20): -0.055, just under the -0.05 threshold. It has been negative since Nov 2 and is improving off the -0.217 low, but it is still showing mild distribution. [Distribution]
- ADX (14): 19.7, weak and range-bound. It has been drifting down from 25.4. −DI (28.8) is barely above +DI (27.9), after +DI led on Nov 12 (31.4 vs 25.8). The DIs are converging, so there is no directional control. [Weak Trend, slight bearish tilt]
- Volume: 49.39M, elevated versus the prior quiet summer. Volume expanded on the Nov 5 capitulation and on the rebound. The Nov 13 decline of about 8.8% came on heavy volume, which makes it a notable rejection. [Elevated, two-way participation]
DIVERGENCES & TRENDS
- MACD vs price: The MACD bullish crossover came with a V-shaped recovery from $404 to $585. The latest bar gave back about 9% of that move, so the crossover is already being tested.
- RSI: Price made a lower low at $404 (versus about $420 in July) while RSI bottomed at 29.7, about the same as the prior troughs. There is no clear divergence. RSI is now rolling over from 57.5 and failed to reach 60.
- CMF: It is trending up from -0.217 but is still below zero, so buyers have not regained control.
- ADX/DI: ADX has been fading since Sep, which means the Sep rally and the Oct pullback both ran out of trend. The DI lines are crossing back and forth, which is typical of a chop zone.
- Moving averages: There is no new golden or death cross. The SMA50D ($554.55) is well above the SMA200D ($423.12), and the EMA50 is above the EMA200, so the long-term structure is bullish. The 50-day averages have flattened (the EMA50 is flat at about $534), and price keeps crossing them.
- VWAP: Price is far above VWAP ($360.73), which shows a long-term profit cushion for buyers.
CHART PATTERNS
- Broad consolidation / possible Bearish Expanding Triangle: Since June, price has made wide swings between about $420 and $650, with a lower high ($585 versus $650) and a slightly lower low ($404 versus $420). The swings are expanding, which is consistent with an expanding triangle. In the reference diagram that pattern is bearish, but it is not clean enough here to act on alone.
- V-shaped recovery: The Nov 5 hammer-like capitulation reversed sharply, and the lower Bollinger Band held. This supports a base around $404–$430.
- Targets: A close above $585–$606 (the Nov 12 high and the upper Bollinger Band) would open a retest of $650. A close below $488 and then $431–$442 (lower Bollinger Band and EMA200) would target the $404 low.
POTENTIAL SCENARIOS
- Scenario 1: Bullish Range Recovery — The long-term uptrend (price above the rising 200-day averages) and the MACD bullish crossover support a grind back toward the upper part of the range as volatility normalizes. Trigger: reclaim and hold above the SMA50D at $554.55 with CMF turning positive. Target: $585–$610. Invalidation: close below $488. (45% probability)
- Scenario 2: Bearish Rejection / Lower High — The Nov 13 high-volume reversal from $585, negative CMF, −DI above +DI and a possible expanding-triangle structure lead to a retest of the lows. Trigger: close below $488.78 and MACD histogram rolling negative. Target: $442 (EMA200), then $404–$431. Invalidation: close above $585. (30% probability)
- Scenario 3: Neutral Chop — ADX stays below 20 and price oscillates around the $534 EMA50/pivot between $480 and $590. Trigger: no decisive break of $488 or $585. Target: $520–$550. Invalidation: close outside the $480–$600 band. (25% probability)
PRICE TARGETS
- Target Price: $565.00 (62-day horizon)
- Expected Range: $480.00 to $615.00 (width $135, about 25.3% of current price, which fits the 18–30% guidance for 61–180 days)
- Key Levels: Support at $442.37 (EMA200, with minor support near $488.78), Resistance at $554.55 (SMA50D, with further resistance at $585.30)
OVERALL BIAS
OVERALL BIAS: BULLISH - Price holds above the rising 200-day averages, the MACD has crossed up from deeply negative levels, and the V-shaped recovery from $404 has held the lower Bollinger Band. Conviction is modest, because ADX is weak, CMF shows mild distribution, and the Nov 13 rejection leaves the $488 support critical.
This is educational analysis and not financial advice.