AMD 34-day bearish forecast — Nov 15, 2026
- Bias: Bearish
- Timeframe: 34 days (made Nov 15, 2026, target date Dec 18, 2026)
- Price at analysis: $534.06
- Price target: $509.00
- Expected range: $468.00 – $556.00
- Result: Pending — graded after the close on Dec 18, 2026
Get a free AI analysis of AMD today
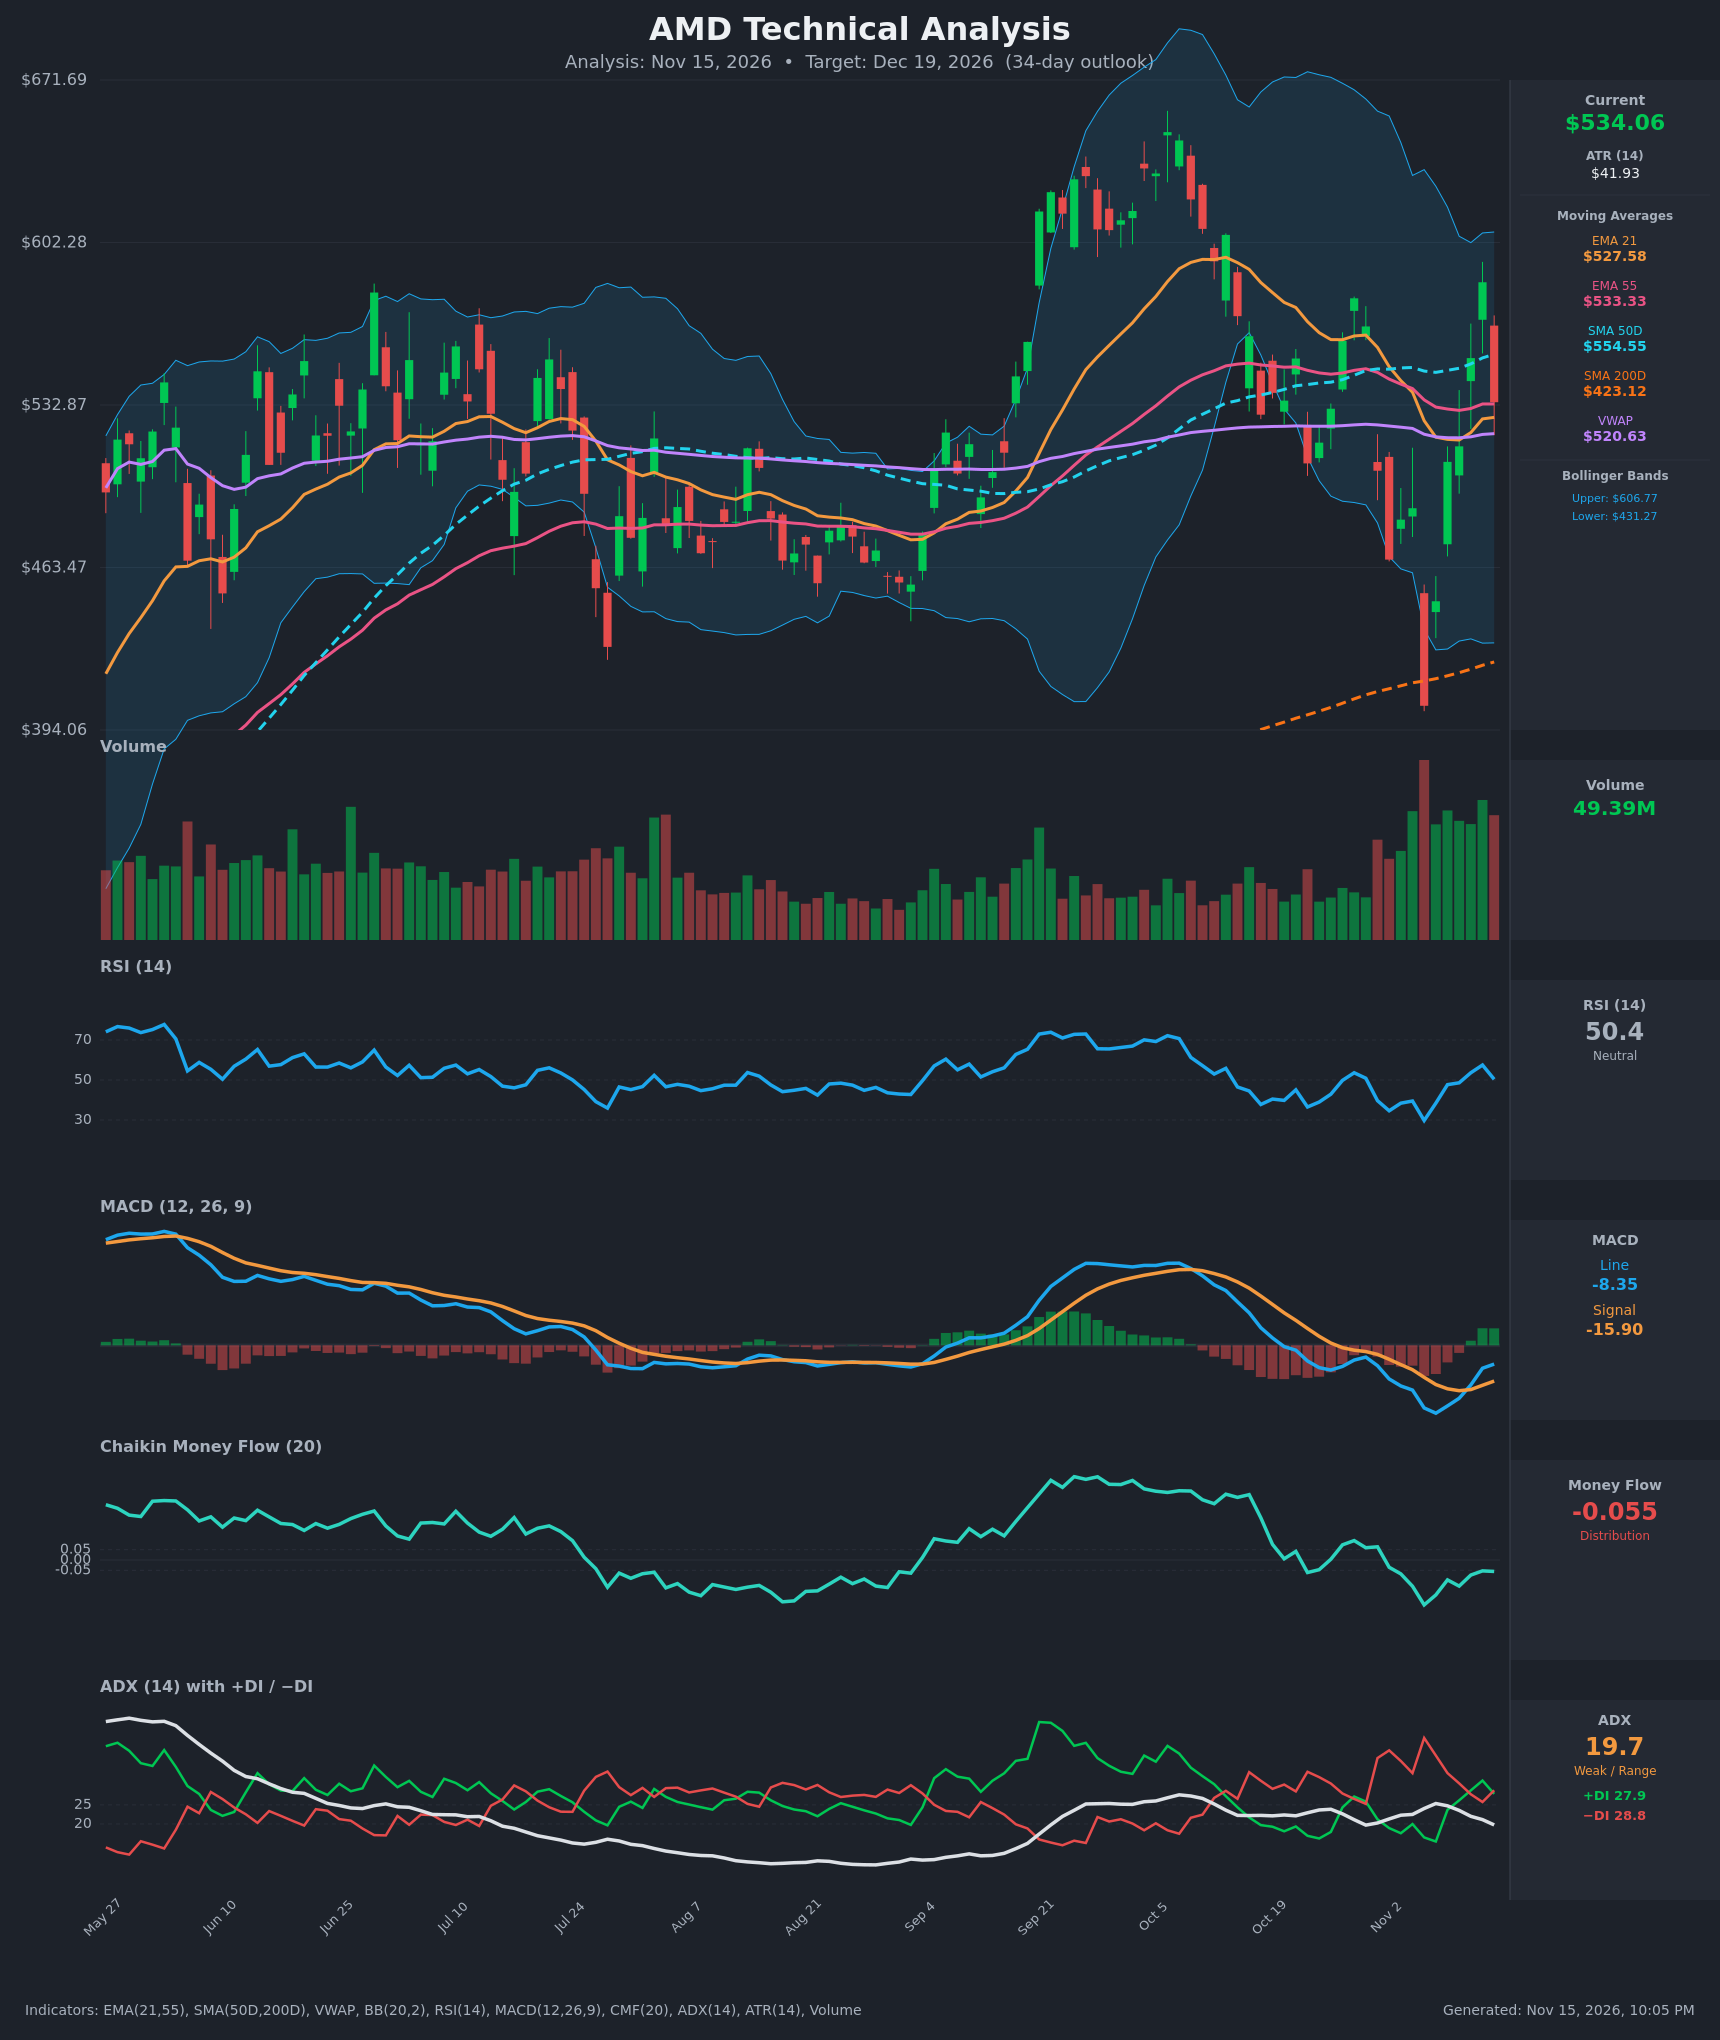
Analysis
TECHNICAL INDICATORS
- RSI (14): 50.36, dead neutral. It fell from 57.5 to 50.4 on the last bar after a rebound from the 29.7 oversold low on Nov 5, so upward momentum is fading. [Neutral]
- 20 EMA: The 21 EMA is $527.58 and price ($534.06) is only about 1.2% above it. The EMA55 is $533.33, so price is sitting right on it. The 21 EMA crossed back above the 55 EMA only marginally (527.58 vs 533.33 still shows 21 below 55), so the short-term structure is flat and indecisive. The $554.55 SMA50 overhead is resistance. [Neutral]
- MACD: Line -8.35 is above signal -15.90, a bullish crossover on Nov 11 with a positive, expanding histogram. Both lines are still below zero, so this looks like a relief bounce inside a larger downswing. The line also ticked down from -10.2 to -8.3 only on a rising basis, so the signal is still intact. [Bullish]
- Bollinger Bands (20): Upper $606.77, lower $431.27, mid about $519. Price is just above the midline, with the bands wide (about 33% of price) after the Nov 5 flush to $404. The Nov 12 high of $585 failed well short of the upper band. [Neutral]
- CMF (20): -0.055, marginally in distribution (below -0.05) after turning sharply from +0.09 in late October. It has been negative for most of the last two weeks, so buyers have not yet shown conviction. [Distribution]
- ADX (14): 19.7 and falling, so the market is weak or range-bound. −DI (28.8) is just above +DI (27.9) after +DI had been on top for two sessions, a slight bearish tilt. [Weak Trend, marginally bearish]
- Volume: 49.39M, well above the summer average. The last bar is a large red candle on heavy volume, which is a sign of supply at the $585 area. The Nov 5 capitulation volume was the heaviest in the chart. [Bearish]
DIVERGENCES & TRENDS
- Price made a higher high on Nov 12 ($585 vs $578 on Oct 28), but RSI peaked at 57.5 versus 53.6, so there is no clear divergence. MACD is far lower than in early October, which shows the bounce is occurring in a weaker momentum regime.
- The MACD bullish crossover (Nov 11) conflicts with CMF distribution and the −DI/+DI flip back to bearish on Nov 13. The conflict is resolved by the Nov 13 price action: an -8.8% reversal from $585.30 to $534.06 on heavy volume.
- Price is above a rising SMA200 ($423.12), which keeps the long-term trend up. It is below the SMA50 ($554.55), which is turning up only slowly, and the SMA50 sits at the failed rally high. No golden or death cross is pending, since the SMA50 is far above the SMA200.
- ADX is below 20 and fading, so the tape is choppy, with big two-way swings ($404 to $585 in about 6 sessions).
CHART PATTERNS
- Loose Bearish Double Top: highs at $578.44 (Oct 28) and $585.30 (Nov 12) with a rejection on the second. The neckline is far away at the $404 flush, so this is not confirmed. A close below roughly $466 to $488 would strengthen it.
- Bearish Expanding Triangle (broadening): the swings are getting wider ($466 to $578 to $404 to $585). This reflects unstable, high-volatility trading with no clear trend, and it tends to resolve down if the lower trendline breaks.
- The bullish counterpoint is the V-shaped recovery from $404 and the position above the SMA200. A close above $585 would invalidate the double-top and broadening reads and aim at $606 to $650.
POTENTIAL SCENARIOS
- Scenario 1: Bearish Rejection and Range Retest — The reversal candle at $585 holds as resistance, price loses the EMA cluster ($527 to $533) and VWAP ($520.63), and drifts back toward the middle of the recent range. Trigger: daily close below $520. Target: $505 first, then $488 to $466. Invalidation: daily close above $556 (SMA50). (45% probability)
- Scenario 2: Bullish Recovery Breakout — The MACD crossover and the SMA200 uptrend carry price back through the SMA50 and revisit the Nov 12 high. Trigger: close above $554.55 on rising volume. Target: $585 then $606 (upper Bollinger Band). Invalidation: close below $505. (35% probability)
- Scenario 3: Neutral Chop — ADX stays below 20 and price oscillates around the EMA/VWAP cluster. Trigger: failure to break either $505 or $555. Target: $520 to $545. Invalidation: close outside $490 to $570. (20% probability)
PRICE TARGETS
- Target Price: $509.00 (34-day, about -4.7% from current)
- Expected Range: $468.00 to $556.00 (width $88, about 16.5% of current price, consistent with the 30-60 day guidance)
- Key Levels: Support at $488.78, Resistance at $554.55
OVERALL BIAS
OVERALL BIAS: BEARISH - A high-volume reversal from $585 back to $534, CMF in distribution, −DI back above +DI, and price stuck below the SMA50 point to a retest of lower support. The MACD crossover and the rising SMA200 limit the downside, and a close above $555 would turn the bias.
This is educational analysis and not financial advice.