AMD 20-day bearish forecast — Nov 15, 2026
- Bias: Bearish
- Timeframe: 20 days (made Nov 15, 2026, target date Dec 4, 2026)
- Price at analysis: $534.06
- Price target: $512.00
- Expected range: $480.00 – $543.00
- Result: Pending — graded after the close on Dec 4, 2026
Get a free AI analysis of AMD today
Analysis
TECHNICAL INDICATORS
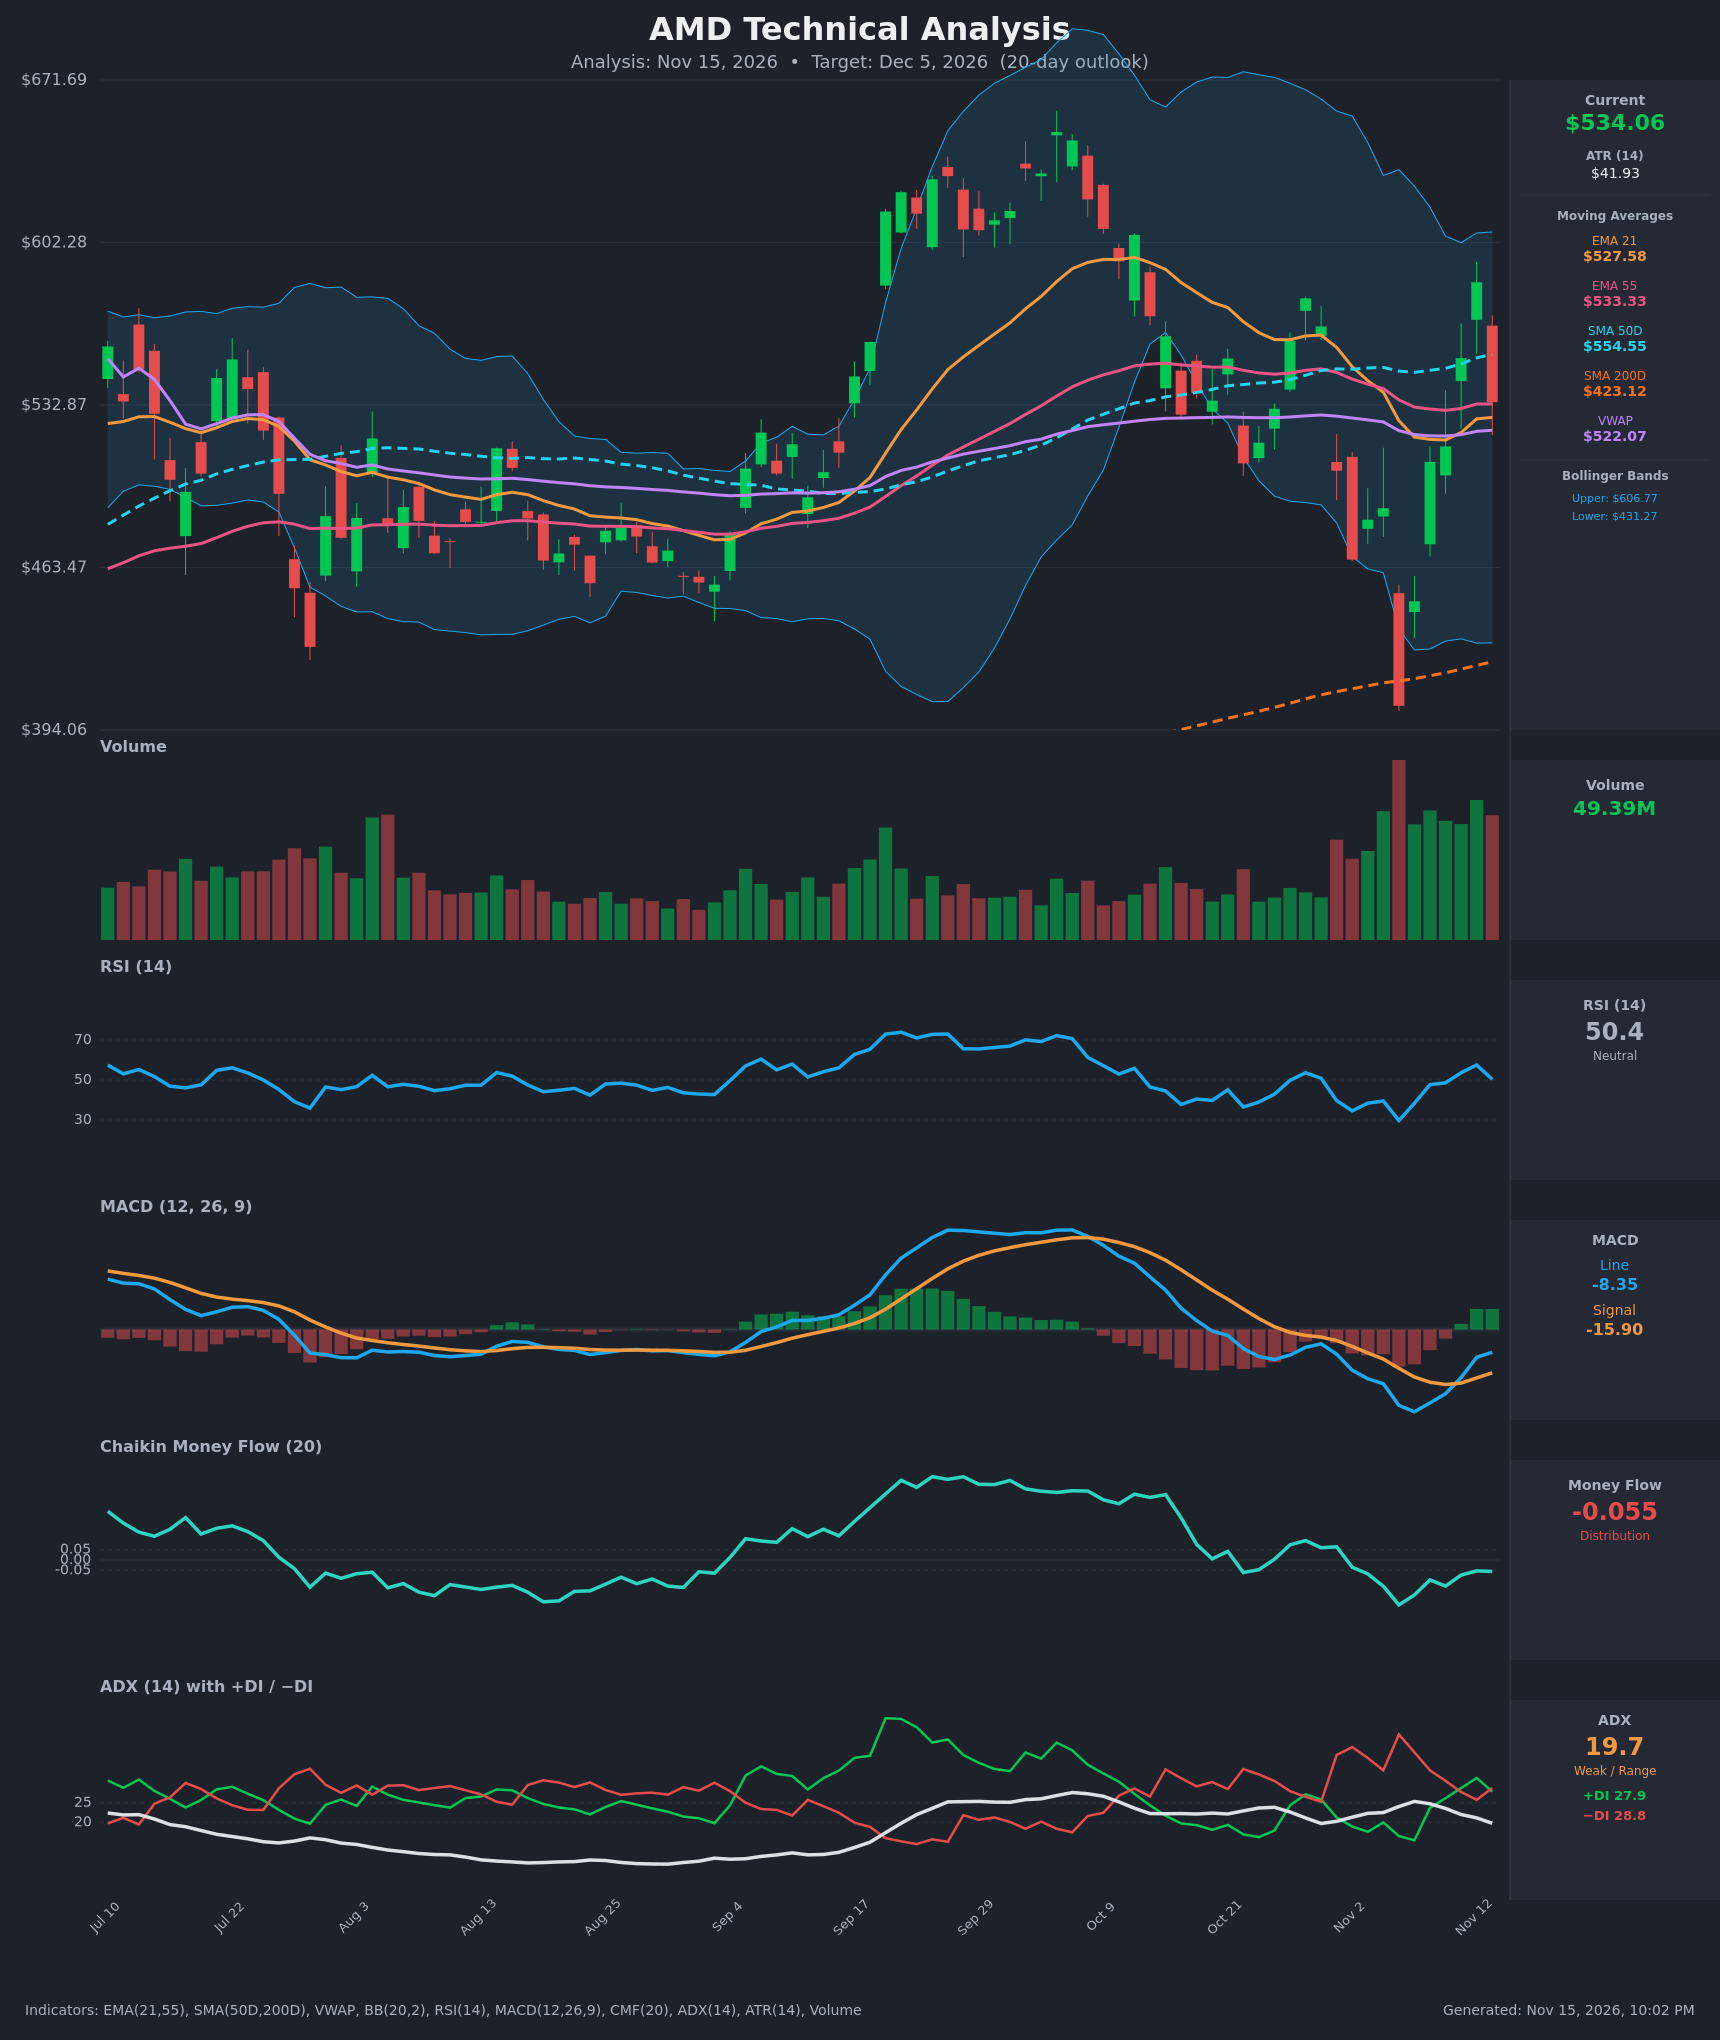
- RSI (14): 50.36, dead neutral. It fell from 57.5 to 50.4 in one session after a rebound from 29.7 on Nov 5. Momentum is rolling over from the recent high but is not weak. [Neutral]
- 20 EMA: The 21 EMA is $527.58 and price ($534.06) sits just above it. It is flat and tightly bunched with the 55 EMA ($533.33), so price is pinned on the short- and medium-term averages. The SMA50D at $554.55 is overhead resistance, and the Nov 13 candle failed beneath it. [Neutral]
- MACD: The line is -8.35 and the signal is -15.90, with a positive histogram of about +7.5. A bullish crossover occurred around Nov 11, but both lines are below zero and the histogram stopped expanding on the last bar. This is a recovery from deeply negative territory, not a confirmed trend change. [Bullish]
- Bollinger Bands (20): Upper $606.77, lower $431.27, midline about $519. Price is slightly above the midline. The bands are very wide (about 33% of price), reflecting extreme volatility. There is room in both directions, but the Nov 12 high ($585) was rejected well below the upper band. [Neutral]
- CMF (20): -0.055, just under the -0.05 threshold. It was positive on Oct 27-30, turned negative during the Nov selloff, and is still negative despite the bounce (about -0.05 to -0.07). Sellers are marginally ahead. [Distribution]
- ADX (14): 19.7 and falling, with -DI (28.8) back above +DI (27.9) after a brief bullish DI cross on Nov 11-12. ADX below 20 means there is no established trend. The slight edge goes to the bears. [Weak Trend, slight bearish tilt]
- Volume: 49.39M on a large red candle (-8.8% from $585.30). Volume has been elevated throughout November. A heavy-volume reversal off the recent high is a distribution-style signal. [Bearish interpretation]
DIVERGENCES & TRENDS
- MACD vs price: MACD turned up from -30 to -8 while price recovered from $404 to $585. That is a healthy momentum recovery, but the last bar's reversal shows it stalling.
- RSI: RSI peaked at 57.5 on Nov 12 and failed to reach the 70 zone seen in September. This is a lower high in momentum, consistent with a bounce inside a larger corrective phase rather than a new impulse.
- Moving averages: There is no golden or death cross. SMA50D ($554.55) is well above SMA200D ($423.12), so the long-term trend is still up. EMA21 and EMA55 are converging with a flat slope, so a crossover is imminent. EMA21 recently crossed back above EMA55 intraday-wise but has not separated.
- VWAP: Price is above VWAP ($522.07), a mild positive, but the gap is small.
- Trend of indicators: ADX has been below 25 for most of the period, with DI lines repeatedly crossing. The market is chopping with violent swings (ATR $41.93, about 7.9% of price) rather than trending.
- Key break: Price lost the SMA50D on the Oct 30 gap down and has not reclaimed it on a closing basis (it closed above on Nov 12 and gave it back on Nov 13).
CHART PATTERNS
- Bearish Expanding Triangle (broadening formation): Swing highs have been roughly equal to slightly higher (about $578, then $585) while swing lows have been lower ($467, then $404). That widening structure matches the Bearish Expanding Triangle in the reference diagram. The Nov 13 rejection from the upper trendline with high volume is the typical start of a downside leg. A measured move would target the lower portion of the range, around $450-$480. A confirmed break below $505 would validate it.
- Counter-view: The V-shaped rebound from $404 could be read as a base-and-recovery. Without a higher low and a close above $554.55-$585, this is not a confirmed reversal pattern.
- Context: The prior large run to $660 (Sep-Oct) followed by a sharp pullback suggests a corrective phase inside a longer-term uptrend, with SMA200D far below at $423.
POTENTIAL SCENARIOS
- Scenario 1: Bearish Rejection at the SMA50 / Expanding Triangle Resolves Lower — The Nov 13 reversal on heavy volume holds, -DI stays on top, CMF stays negative, and price loses the 21/55 EMA cluster. Trigger: daily close below $505 (Nov 9 close area, about $508). Target: $480-$512, with an extension toward $450. Invalidation: daily close above $554.55 (SMA50D). (47% probability)
- Scenario 2: Bullish Reclaim of SMA50 and Recovery Continuation — MACD stays above its signal, price holds the EMA cluster, and buyers reclaim the SMA50D, extending the V-shaped recovery. Trigger: close above $555 on rising volume. Target: $585-$606 (Nov 12 high, then upper Bollinger Band). Invalidation: close below $505. (33% probability)
- Scenario 3: Neutral Choppy Range — Price oscillates between the EMA cluster and the SMA50D with ADX staying below 20. Trigger: repeated closes between $505 and $555. Target: $520-$545. Invalidation: close outside $505-$555. (20% probability)
PRICE TARGETS
- Target Price: $512.00 (20-day horizon, about -4.1% from current)
- Expected Range: $480.00 to $543.00 (width $63, about 11.8% of current price, consistent with the 14-21 day guidance of 8-12%)
- Key Levels: Support at $505.00 (Oct 30 / Nov 9 consolidation area), Resistance at $554.55 (SMA50D)
OVERALL BIAS
OVERALL BIAS: BEARISH - A heavy-volume rejection from $585 beneath the SMA50D, -DI back above +DI, CMF slipping into mild distribution, and a broadening (expanding triangle) structure tilt the balance modestly lower. The weak ADX (19.7) and the bullish MACD crossover keep conviction modest, and a reclaim of $554.55 would invalidate the call.
This is educational analysis and not financial advice.