RKLB 6-day bearish forecast — Nov 1, 2026
- Bias: Bearish
- Timeframe: 6 days (made Nov 1, 2026, target date Nov 6, 2026)
- Price at analysis: $54.72
- Price target: $53.30
- Expected range: $49.90 – $57.30
- Result: Correct (-1.9%) — closed at $53.66 on Nov 6, 2026; quality score 100/100
Get a free AI analysis of RKLB today
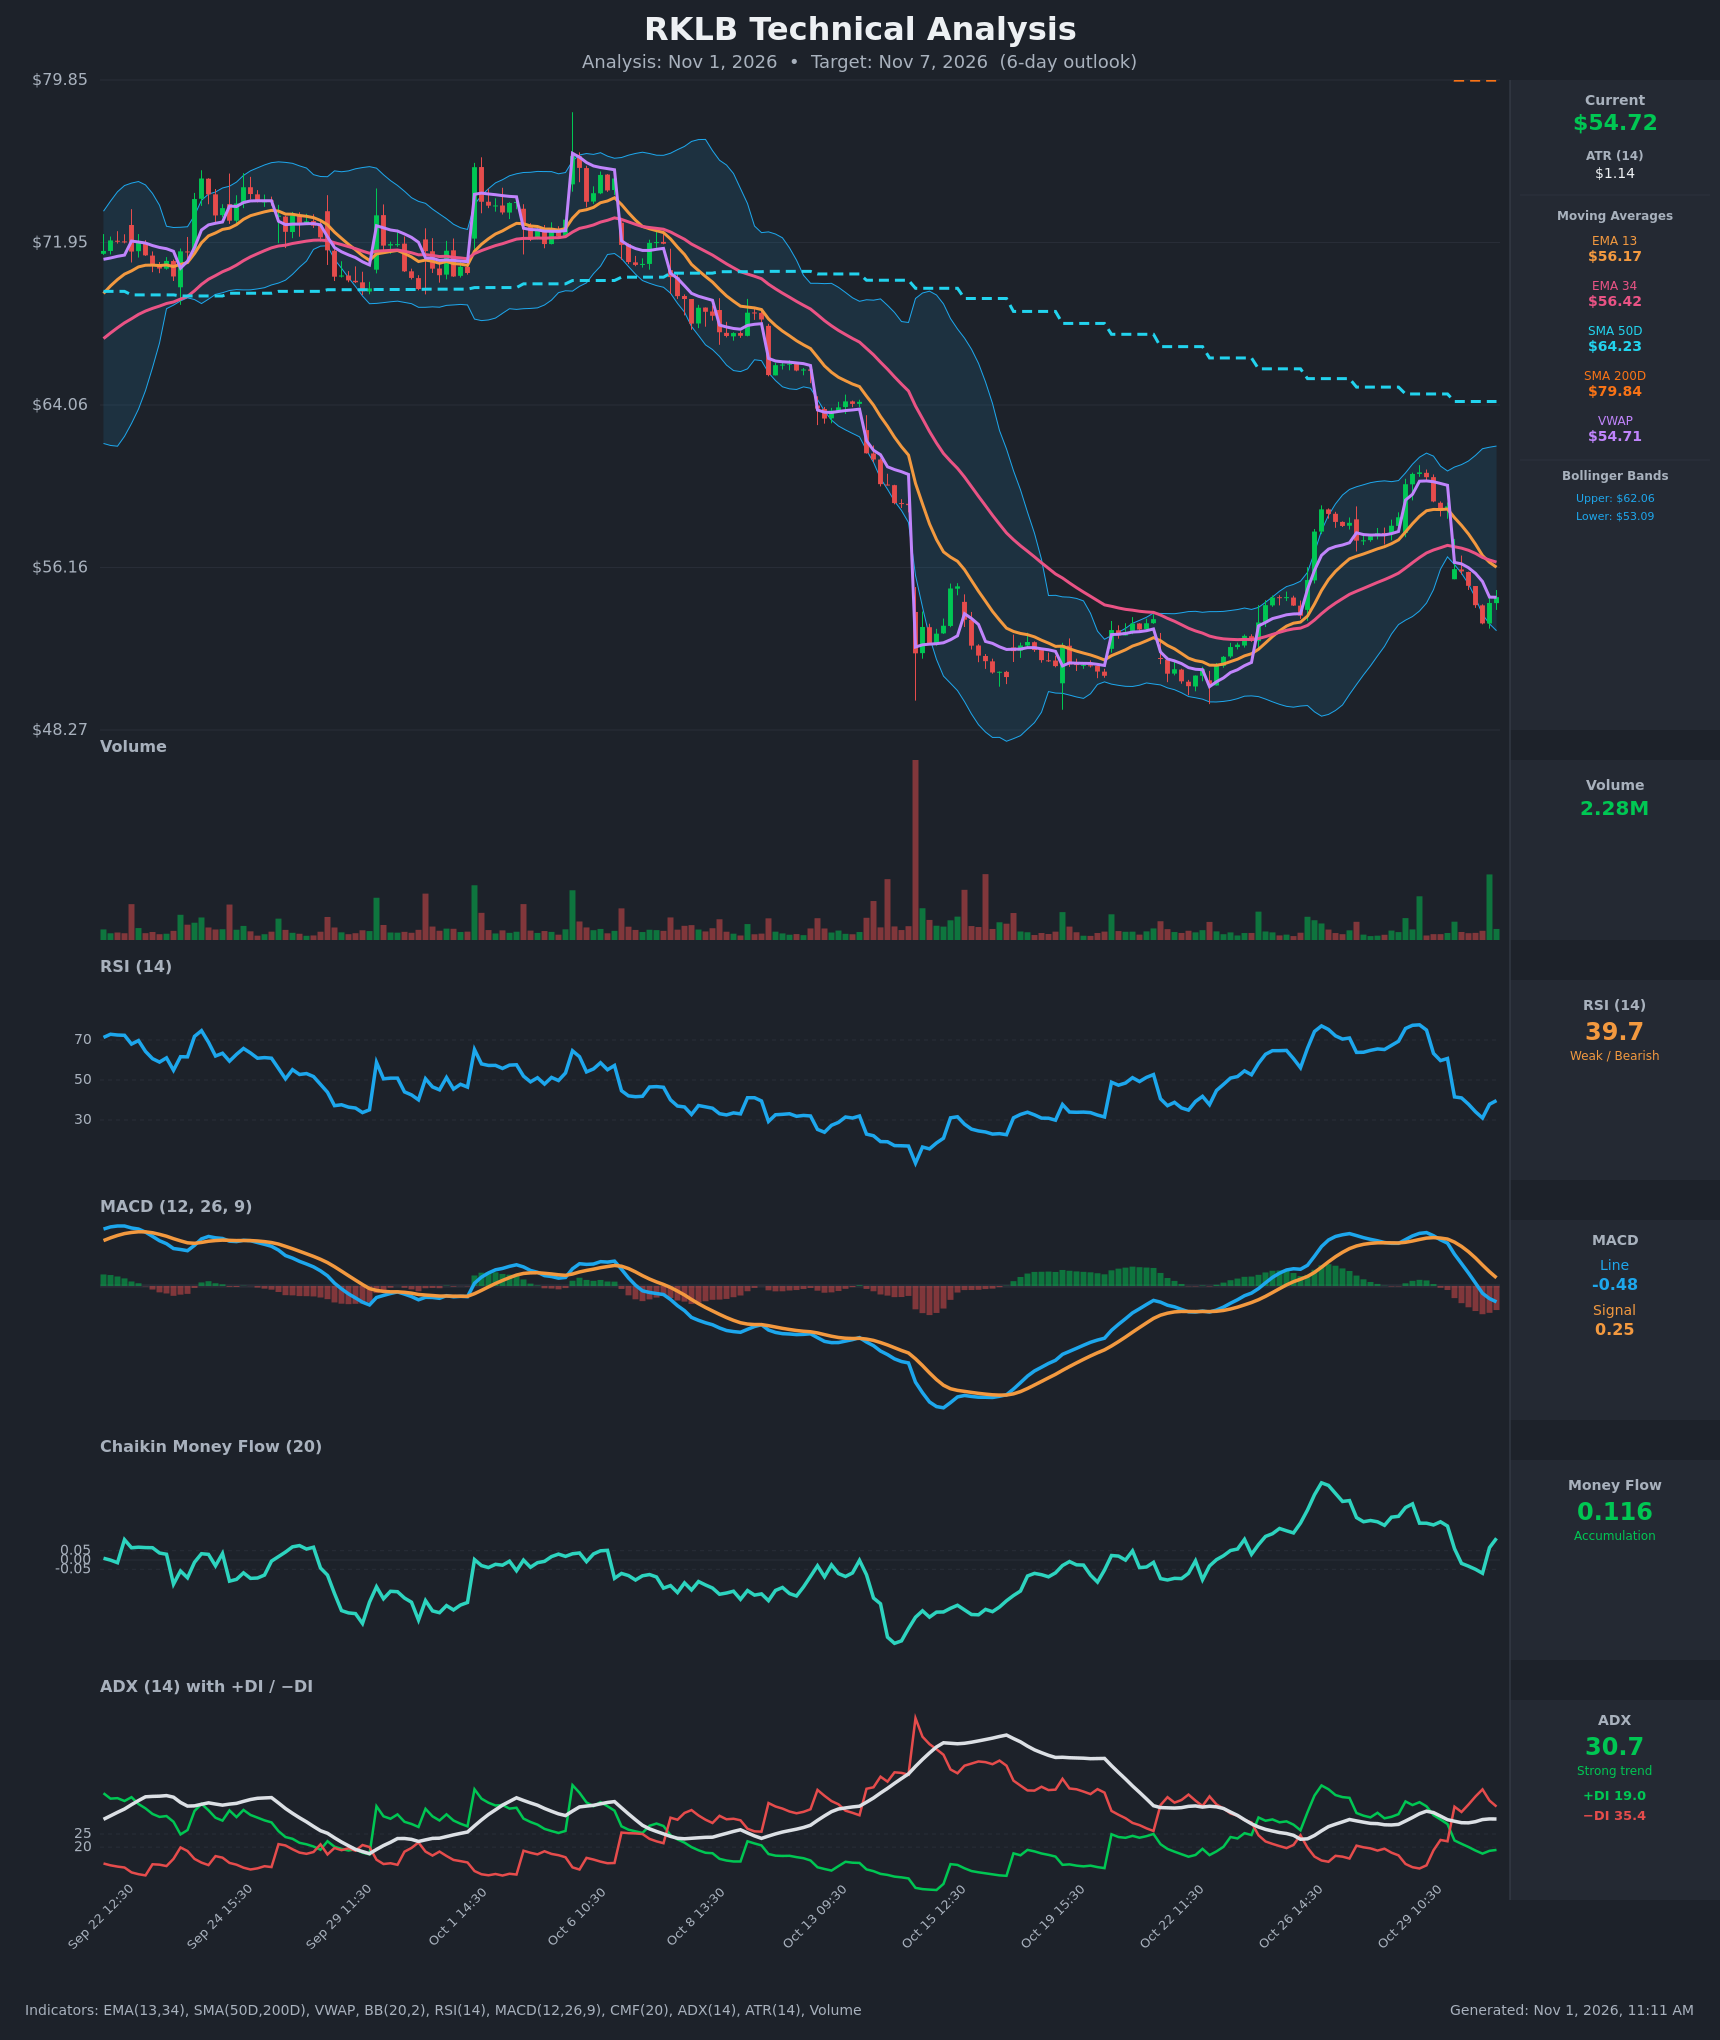
Analysis
TECHNICAL INDICATORS
- RSI (14): 39.73, rebounding slightly from a 31.0 low on Oct 30 13:30 but down sharply from 77.6 on Oct 29. It sits below 50 with a bearish momentum reset, and the bounce is still weak. [Bearish]
- EMA 13 / EMA 34: EMA13 is $56.17 and EMA34 is $56.42. EMA13 crossed below EMA34 on Oct 30 13:30–14:30, a fresh bearish crossover. Price at $54.72 is below both, so they act as overhead resistance in the $56.17–$56.42 zone. [Bearish]
- MACD: Line -0.48 is below signal 0.25, after a bearish crossover on Oct 30 around 09:30–10:30. The histogram is negative and widening (about -0.73). Momentum is turning down from a failed push higher. [Bearish]
- Bollinger Bands (20): Upper $62.06, lower $53.09. Price at $54.72 is in the lower quarter of the band, about $1.63 above the lower band. The bands are wide, and the sharp reversal from the upper-band area suggests a failed breakout. A tag of the lower band is possible, and a bounce is possible if it holds. [Bearish]
- CMF (20): 0.116, above +0.05, and it ticked up from -0.07 over the last two bars. Accumulation persists on the multi-day view, a modest counter-signal to the price drop. [Accumulation]
- ADX (14): 30.7 with −DI 35.4 over +DI 19.0. This is a strong trend, and the bears are in control after the DI crossover on Oct 30 (−DI jumped from 22 to 35). [Strong Trend – Bearish]
- Volume: 2.28M on the latest bar, with a large green spike on the final bar of the chart. This suggests dip-buying or a capitulation attempt, but it is not yet confirmed by follow-through. [Mildly Bullish / Unconfirmed]
- VWAP / SMAs: VWAP $54.71, so price is exactly at VWAP, a pivot. SMA50D $64.23 and SMA200D $79.84 are both far overhead and falling. Price is well below SMA200D (long-term downtrend), and the SMA50D is below the SMA200D (death-cross regime). [Bearish]
DIVERGENCES & TRENDS
- No clear divergence. The RSI low of 31 on Oct 30 coincided with a price low of $53.45, and the bounce is only modest.
- CMF is positive while price falls. This is a mild bullish divergence, suggesting the selling was not heavy distribution, though it is a one-bar flip from negative.
- The rally from ~$50 to ~$61 (Oct 22–29) was fully retraced by about 70% in two sessions. The RSI rollover from 77 and the MACD bearish cross confirm the failed breakout.
- A bearish EMA 13/34 cross and a −DI surge (35 vs 19) confirm that the short-term trend has turned down.
- The broader trend remains a downtrend, with lower highs ($75 → $61) and price below both SMAs.
CHART PATTERNS
- The broad structure looks like a Bearish Double Top / failed breakout on the multi-week view: peaks near $75 and a lower high near $61, with a decline from them.
- The Oct 15–29 base followed by a rally to the Bollinger upper band resembles a possible Bullish Double Bottom attempt (lows ~$50–51). That neckline is near $61, and it was rejected, so the pattern failed.
- The current pullback is testing the lower Bollinger Band and the $53.00–$53.45 intraday low. A break lower targets the Oct 22–26 consolidation low of about $50–51, the base of the prior range.
- A bearish continuation (flag/pennant style) would resolve lower if price fails at the $56.2–$56.4 EMAs.
POTENTIAL SCENARIOS
- Scenario 1: Bearish Continuation Lower — The EMA bearish cross, MACD cross and −DI dominance point to continued selling, with rallies capped at the EMAs. Trigger: failure at $56.2–$56.4 or a break below $53.45. Target: $51.00–$52.00, possibly $50.50. Invalidation: a daily close above $57.00. (50% probability)
- Scenario 2: Neutral Consolidation/Bounce at Lower Band — Positive CMF, a high-volume final bar and an RSI near 31–40 produce a base around $53–$56. Trigger: holding $53.09 with a rebound to VWAP and the EMAs. Target: $55.00–$56.50. Invalidation: a break below $53.00 or above $57.00. (30% probability)
- Scenario 3: Bullish Reversal Squeeze — Dip buyers lift price back above the EMAs, with the strong volume bar marking a local low. Trigger: a close above $56.50 with an MACD histogram turn. Target: $58.50–$60.00. Invalidation: a drop below $53.40. (20% probability)
PRICE TARGETS
- Target Price: $53.30 (6-day)
- Expected Range: $49.90 to $57.30 (width $7.40, about 13.5% of the current price; ATR of $1.14 supports a roughly 6-day move of ±$2.8 as a typical expectation, with fat tails for the downside break)
- Key Levels: Support at $53.09 (lower Bollinger Band; then $50.50), Resistance at $56.17 (EMA13; then $56.42 EMA34)
OVERALL BIAS
OVERALL BIAS: BEARISH - Fresh bearish EMA and MACD crossovers, a strong ADX of 30.7 with −DI at 35 vs +DI at 19, and price below all key moving averages and under VWAP-area resistance point to further downside toward $51–$53. Positive CMF and the high-volume final bar lend only modest counter-support.
This is educational analysis and not financial advice.