RKLB 27-day bearish forecast — Nov 15, 2026
- Bias: Bearish
- Timeframe: 27 days (made Nov 15, 2026, target date Dec 11, 2026)
- Price at analysis: $61.53
- Price target: $58.00
- Expected range: $53.50 – $64.50
- Result: Pending — graded after the close on Dec 11, 2026
Get a free AI analysis of RKLB today
Analysis
TECHNICAL INDICATORS
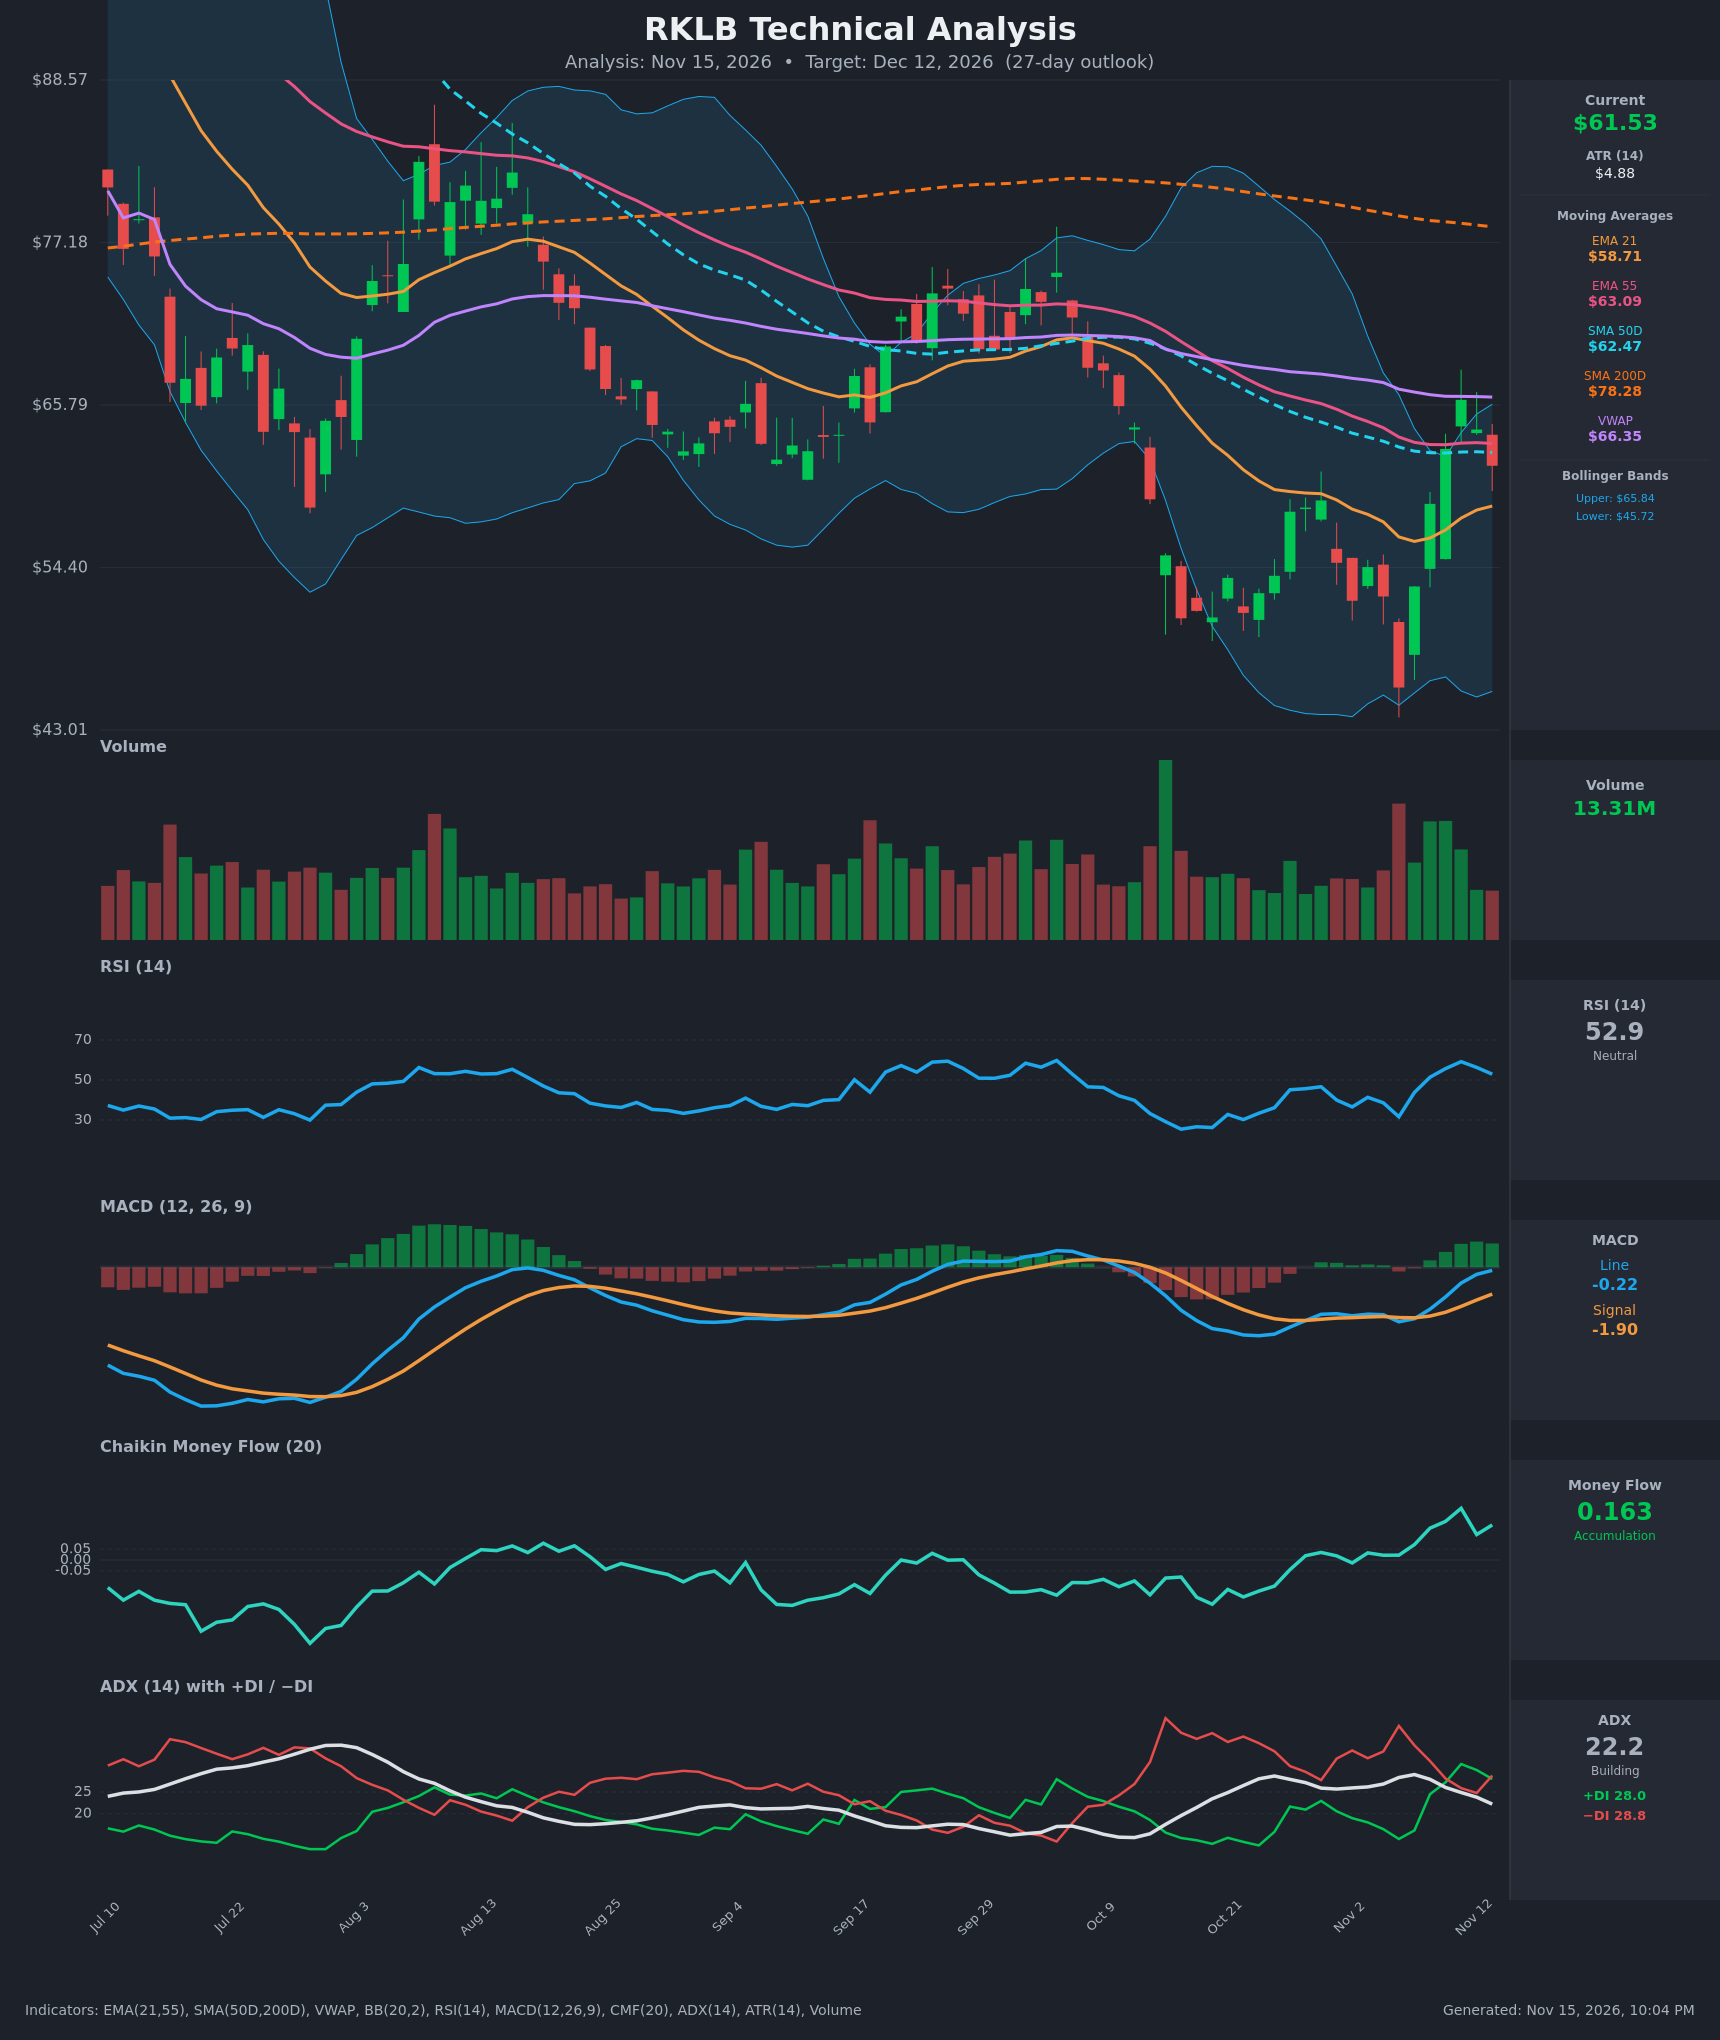
- RSI (14): 52.91, rolling over from 59.2 on Nov 11 and now back near the midline. The bounce from the Nov 5 low (RSI 31.6) has lost steam. [Neutral]
- 20 EMA (EMA 21): $58.71. Price ($61.53) is above it and the EMA is rising, so it is the first support. EMA 21 is still below EMA 55 ($63.09), so the bearish EMA structure persists. [Neutral]
- MACD: Line -0.22 vs. signal -1.90. The line crossed above the signal around Nov 9-10 and the histogram is positive (about +1.7). The rate of improvement slowed on Nov 13 (-0.506 to -0.222), and the line is still below zero. [Bullish]
- Bollinger Bands (20): Upper $65.84, lower $45.72, midline about $55.8. The bands are very wide after the October-November selloff. Price tagged the upper band on Nov 11 ($66.15), was rejected, and has now closed back inside with a red candle. The upper band also sits near VWAP ($66.35) and EMA 55. [Neutral]
- CMF (20): 0.163, well above +0.05 and rising since early November. This is a clear accumulation signal and the strongest bullish evidence on the chart. [Accumulation]
- ADX (14): 22.2 and falling from 29.0, so trend strength is fading. +DI (28.0) has just dropped below −DI (28.8), a marginal bearish crossover after bulls led on Nov 10-12. [Weak Trend, slight bearish tilt]
- Volume: 13.31M, below the heavy-volume rally days around Nov 9-11. The latest pullback day has lighter volume, so there is no panic selling yet, but follow-through buying is also fading. [Neutral]
DIVERGENCES & TRENDS
- Long-term trend: Price is far below the SMA200 ($78.28), and the SMA50 ($62.47) is below the SMA200, so the death cross is in force. The long-term trend is down.
- Moving-average resistance: Price sits just below a cluster of resistance: SMA50 $62.47, EMA55 $63.09 and VWAP $66.35. Price closed above the SMA50 and EMA55 on Nov 10-12, then lost both on Nov 13.
- Momentum: RSI and MACD both made higher lows from the Nov 5 washout, which is constructive. RSI has topped at 59 and is declining, though, and MACD's pace of improvement is slowing.
- Possible divergence: CMF is at a multi-month high while price is still below key MAs. This suggests accumulation but needs a close back above $63-66 to confirm.
- Directional movement: The +DI/−DI crossover is only marginal. Falling ADX means this is a choppy transition, not a strong trend.
- Failed breakout: The rejection at $66 is a failed test of the Bollinger upper band and the VWAP/EMA55 zone.
CHART PATTERNS
- Bullish Double Bottom (loose): The lows around $46-50 in late Oct/early Nov are the two bottoms, with a neckline near $66. The Nov 11 high of $66.15 tested that neckline and was rejected. A confirmed close above $66.5 would project roughly $80+, but the pattern is not confirmed.
- Rejection beneath a resistance cluster: The rally stalled at the converging SMA50, EMA55, VWAP and upper Bollinger Band. This resembles a bounce inside a larger downtrend, similar to the Bearish Flag/Pennant continuation logic, though the structure is too irregular to call a clean pattern.
- Range: A broad trading range of about $50-$66 is forming, with price in the upper half of it.
POTENTIAL SCENARIOS
- Scenario 1: Bearish Failed Rally, Pullback Toward EMA 21 and Midband — Price is rejected at the SMA50/EMA55 cluster, DI stays bearish and ADX keeps fading. Price drifts back toward the EMA 21 and the Bollinger midline. Trigger: close below $58.70 (EMA 21). Target: $55-$58, with an extension to $52. Invalidation: daily close above $66.50. (45% probability)
- Scenario 2: Bullish Breakout on Accumulation — CMF accumulation and the positive MACD histogram carry price through $63-$66. Trigger: close above $66.50 (VWAP and the upper band) on rising volume. Target: $70-$72. Invalidation: close below $56. (33% probability)
- Scenario 3: Neutral Range Consolidation — Price chops between the EMA 21 and the MA cluster. Trigger: ADX stays below 20 with closes between $57 and $64. Target: $59-$63. Invalidation: a close outside $55-$66. (22% probability)
PRICE TARGETS
- Target Price: $58.00 (27-day)
- Expected Range: $53.50 to $64.50 (width $11.00, about 17.9% of current price, in line with the 30-60 day guidance)
- Key Levels: Support at $58.71 (EMA 21), with deeper support at $52.07/$50. Resistance at $62.47 (SMA50), then $63.09 (EMA 55) and $66.35 (VWAP).
OVERALL BIAS
OVERALL BIAS: BEARISH - Price is below the SMA200 with a death cross in force and was rejected at the SMA50/EMA55/VWAP cluster. RSI is rolling over, ADX is fading, and −DI has retaken the lead. Strong CMF accumulation and a positive MACD histogram limit the downside, so conviction is modest and a pullback toward the $58 area is favored.
This is educational analysis and not financial advice.