RKLB 83-day bullish forecast — Nov 15, 2026
- Bias: Bullish
- Timeframe: 83 days (made Nov 15, 2026, target date Feb 5, 2027)
- Price at analysis: $61.53
- Price target: $66.50
- Expected range: $54.00 – $72.00
- Result: Pending — graded after the close on Feb 5, 2027
Get a free AI analysis of RKLB today
Analysis
TECHNICAL INDICATORS
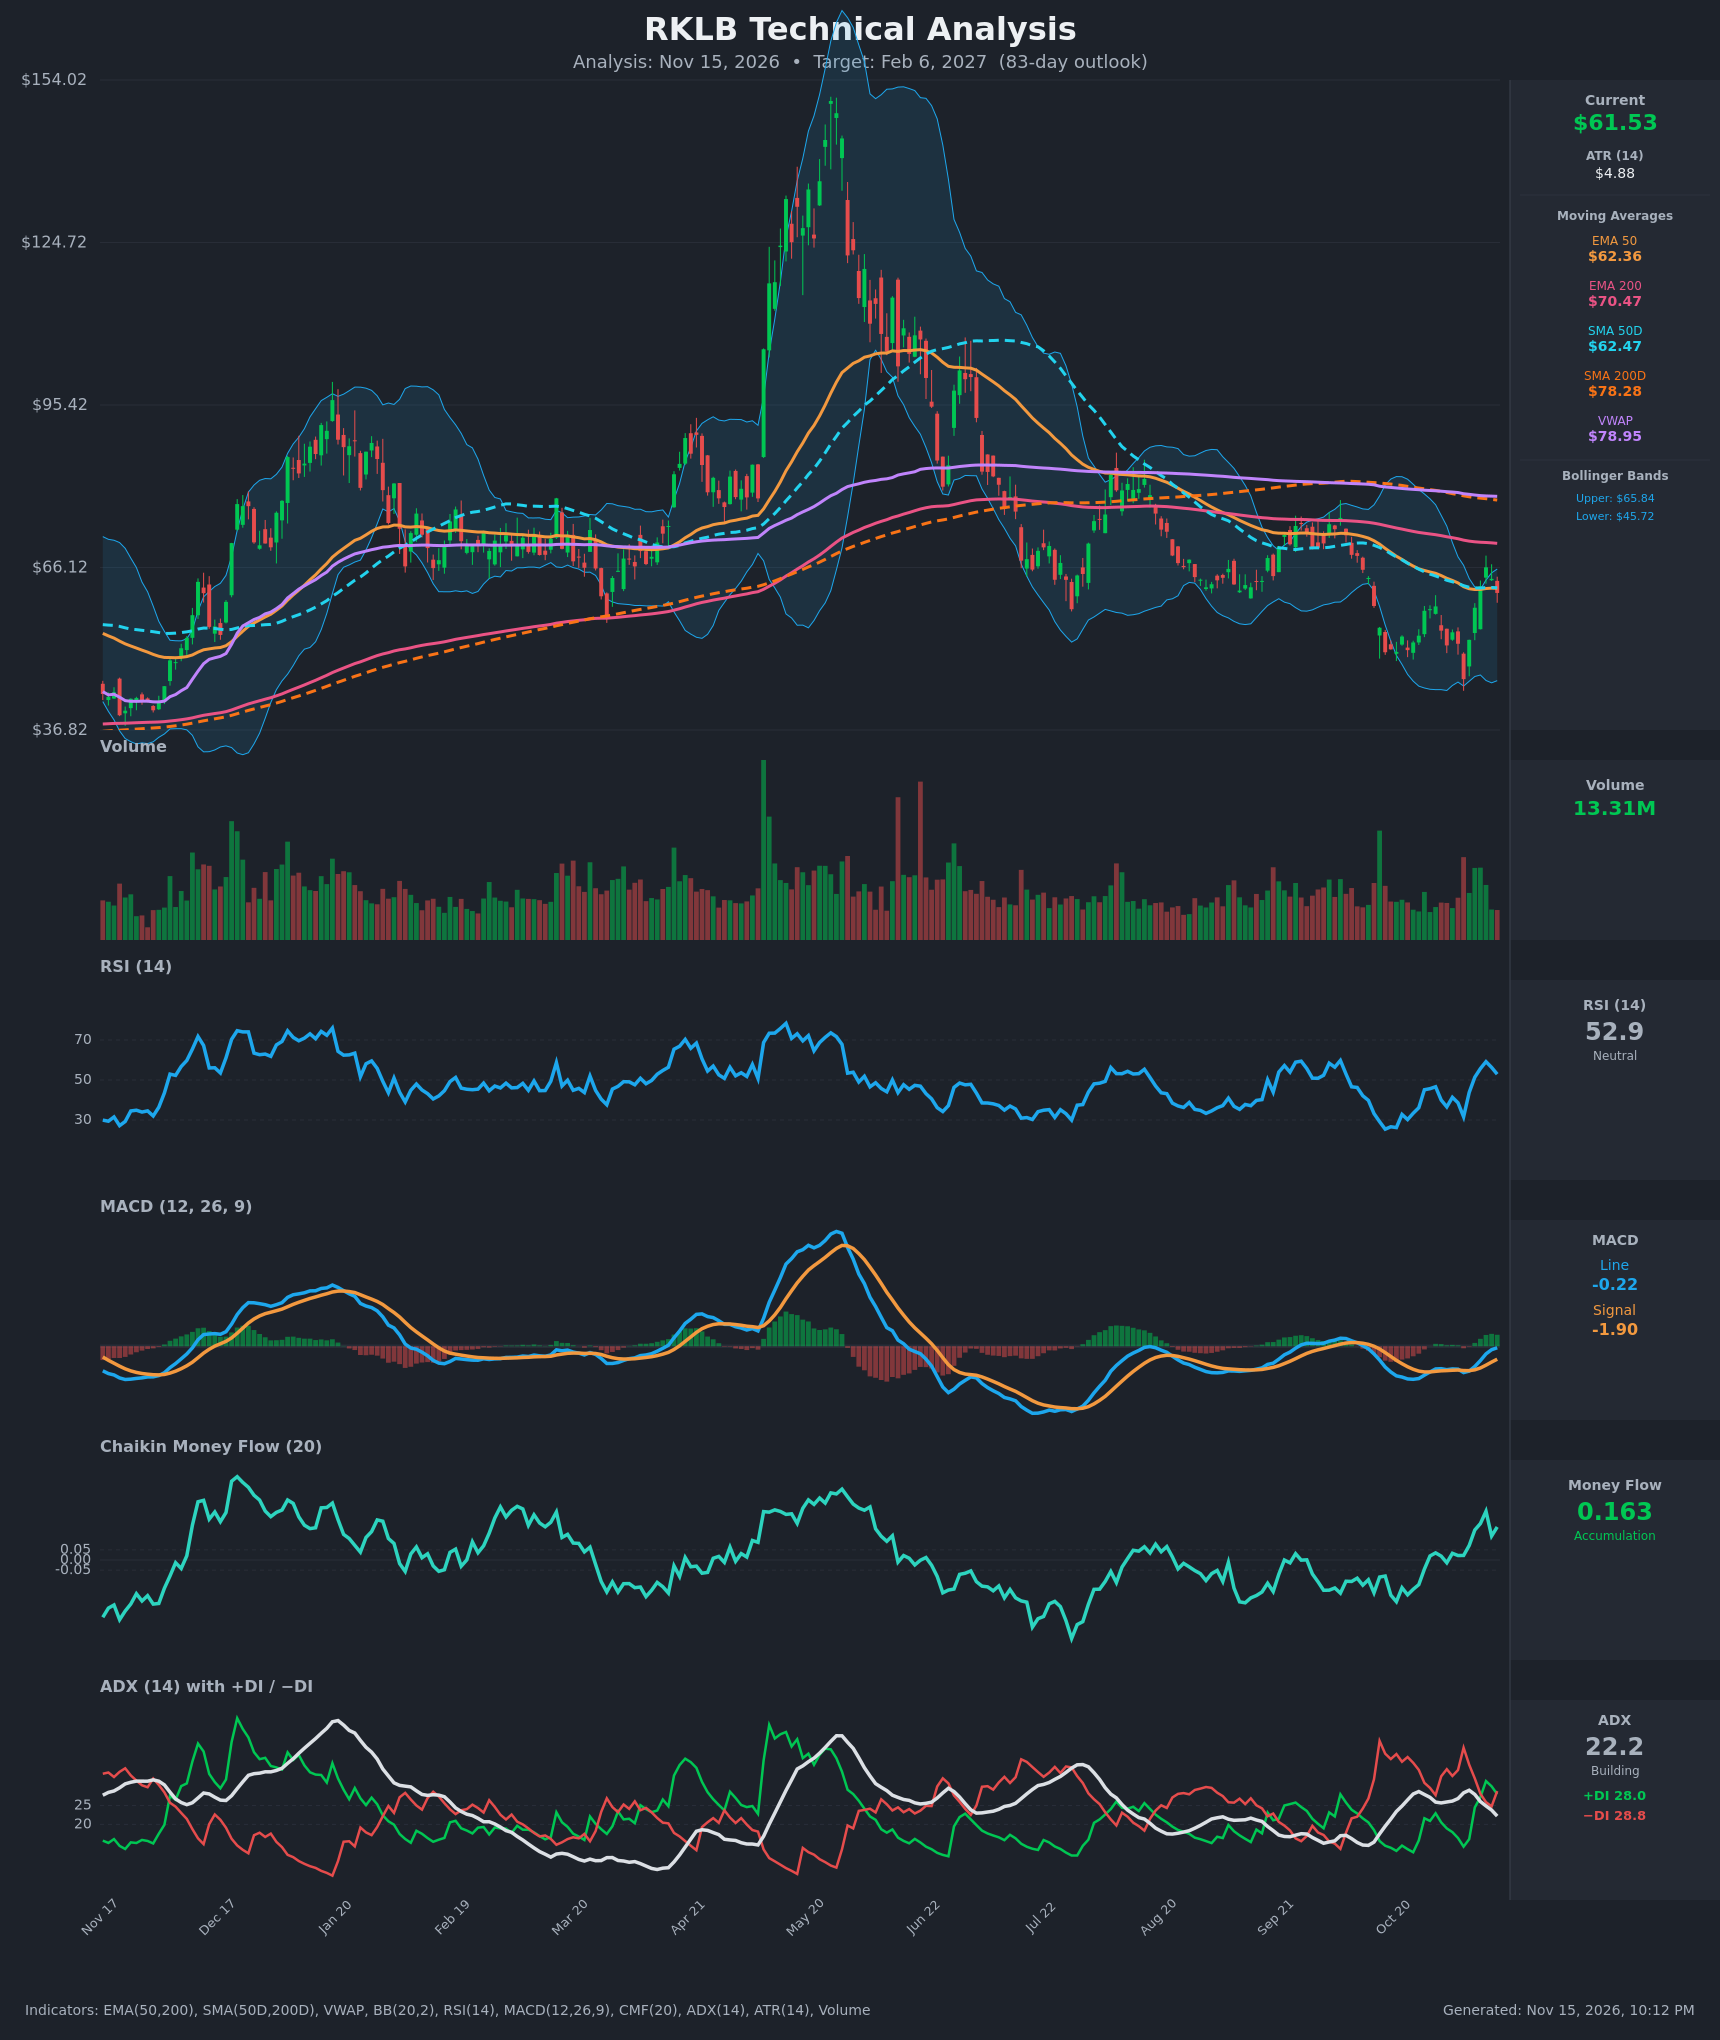
- RSI (14): 52.91, back near the midline after rising from 31.6 on Nov 5 and peaking at 59.2 on Nov 11. It has slipped for two sessions, but momentum has recovered well from the late-October oversold area. [Neutral]
- 20 EMA: Not supplied. The EMA50 ($62.36) and SMA50D ($62.47) are the nearest proxies, and price at $61.53 sits just under both. They have flattened after sloping down for weeks, and the Nov 11 close of $66.15 was rejected from this zone. Overhead are the EMA200 ($70.47), SMA200D ($78.28) and VWAP ($78.95). [Neutral]
- MACD: Line -0.22 versus signal -1.90, a histogram of about +1.68. The histogram has turned positive and widened over eight sessions, and the line has risen from -4.73. Both are still below zero, so this is a recovery rather than a confirmed trend, but the momentum shift is bullish. [Bullish]
- Bollinger Bands (20): Upper $65.84, lower $45.72, midline about $55.78. Price is above the midline and in the upper third of the band. The bands are fairly wide, which fits the high volatility. After tagging the lower band on Nov 5 ($45.99), price rallied to the upper band on Nov 11 ($66.15) and has since pulled back. [Neutral]
- CMF (20): 0.163, well above +0.05 and the strongest reading in several months. It has been positive and rising since Nov 6 even as price pulled back, which shows buyers absorbing supply near the lows. [Accumulation]
- ADX (14): 22.2 and falling from 29.0. +DI is 28.0 and −DI is 28.8, a near-tie with −DI marginally on top after +DI led on Nov 11-12. The trend is weak and undecided. [Weak Trend – no clear direction]
- Volume: 13.31M, in line with recent averages and well below the spike levels seen in the rally to $150. The rebound bars from the Nov 5 low carried decent volume, with the green bars slightly dominant. [Mildly supportive, no strong confirmation]
DIVERGENCES & TRENDS
- Bullish divergence: Price made a lower low around Nov 5 ($45.99) while RSI (about 31.6) and MACD held above their prior troughs. CMF is also making higher highs while price consolidates under resistance.
- Moving averages: The structure is still bearish long-term. Price is below the EMA200 and SMA200D. A death cross is in place (SMA50D $62.47 below SMA200D $78.28; EMA50 below EMA200). The gap between the 50s and 200s is narrowing slowly.
- Crossovers: The MACD line is closing on the signal line and a bullish cross looks likely within days. The +DI/−DI lines are tangled, so there is no directional signal. Price is oscillating around the 50-day averages, which is the key pivot.
- Trend: The multi-month trend is down from the ~$150 peak. The last two weeks show a V-shaped recovery from the lows that has stalled at the 50-day cluster and the upper Bollinger Band.
CHART PATTERNS
- Bullish Double Bottom (reversal): Lows of roughly $46-47 in late October and $45.99 on Nov 5 form a potential double bottom. The neckline is near $66, the Nov 11 high and the upper Bollinger Band. A confirmed close above $66-67 would project a measured move of about $20 (roughly $86). That target is limited by the EMA200 at $70.5 and the SMA200D/VWAP at $78-79.
- Possible base or range: The last four months show a broad base between roughly $46 and $72. This is not a perfect pattern, so I treat it as a consolidation that is trying to turn up.
- Bearish risk: Failure at the neckline would revert to a lower-high structure. The downtrend would stay intact, and a retest of $46 or lower would follow.
POTENTIAL SCENARIOS
- Scenario 1: Bullish Double-Bottom Breakout and Grind Higher — The MACD crosses up, CMF stays in accumulation, and price reclaims the 50-day averages and breaks the $66 neckline. The rally then runs into the EMA200 area. Trigger: daily close above $66.15 on rising volume. Target: $66.50 at day 83, with an interim test of $70.50 and potential extension toward $75. Invalidation: close below $52. (50% probability)
- Scenario 2: Bearish Rejection Under the 50s — The recovery fails at the EMA50/SMA50D and the long-term MAs, which are still in a death-cross configuration. −DI takes control and price retests the lows. Trigger: close below $57 (the recent pullback zone) with MACD rolling over. Target: $48-$50, and a breakdown could reach $44. Invalidation: close above $66.15. (33% probability)
- Scenario 3: Neutral Range Consolidation — Price chops between the 50-day cluster and the Bollinger midline, with low ADX keeping direction muddled. Trigger: failure to break either $66 or $52. Target: $58-$64. Invalidation: a close outside $52-$66. (17% probability)
PRICE TARGETS
- Target Price: $66.50 (83-day horizon)
- Expected Range: $54.00 to $72.00. The $18.00 width is about 29% of the current price, which fits the 61-180 day guidance and reflects the high ATR of $4.88.
- Key Levels: Support at $52.00, Resistance at $66.15
OVERALL BIAS
OVERALL BIAS: BULLISH - MACD is crossing up from a bullish divergence at the Nov 5 low, CMF shows the strongest accumulation in months, and a double-bottom neckline near $66 is in play. Conviction is modest: price is still below the long-term moving averages and ADX shows no trend, so a failure at the $62-66 resistance zone is a real risk.
This is educational analysis and not financial advice.