RKLB 48-day bullish forecast — Nov 15, 2026
- Bias: Bullish
- Timeframe: 48 days (made Nov 15, 2026, target date Jan 1, 2027)
- Price at analysis: $61.53
- Price target: $65.00
- Expected range: $58.00 – $69.00
- Result: Pending — graded after the close on Jan 1, 2027
Get a free AI analysis of RKLB today
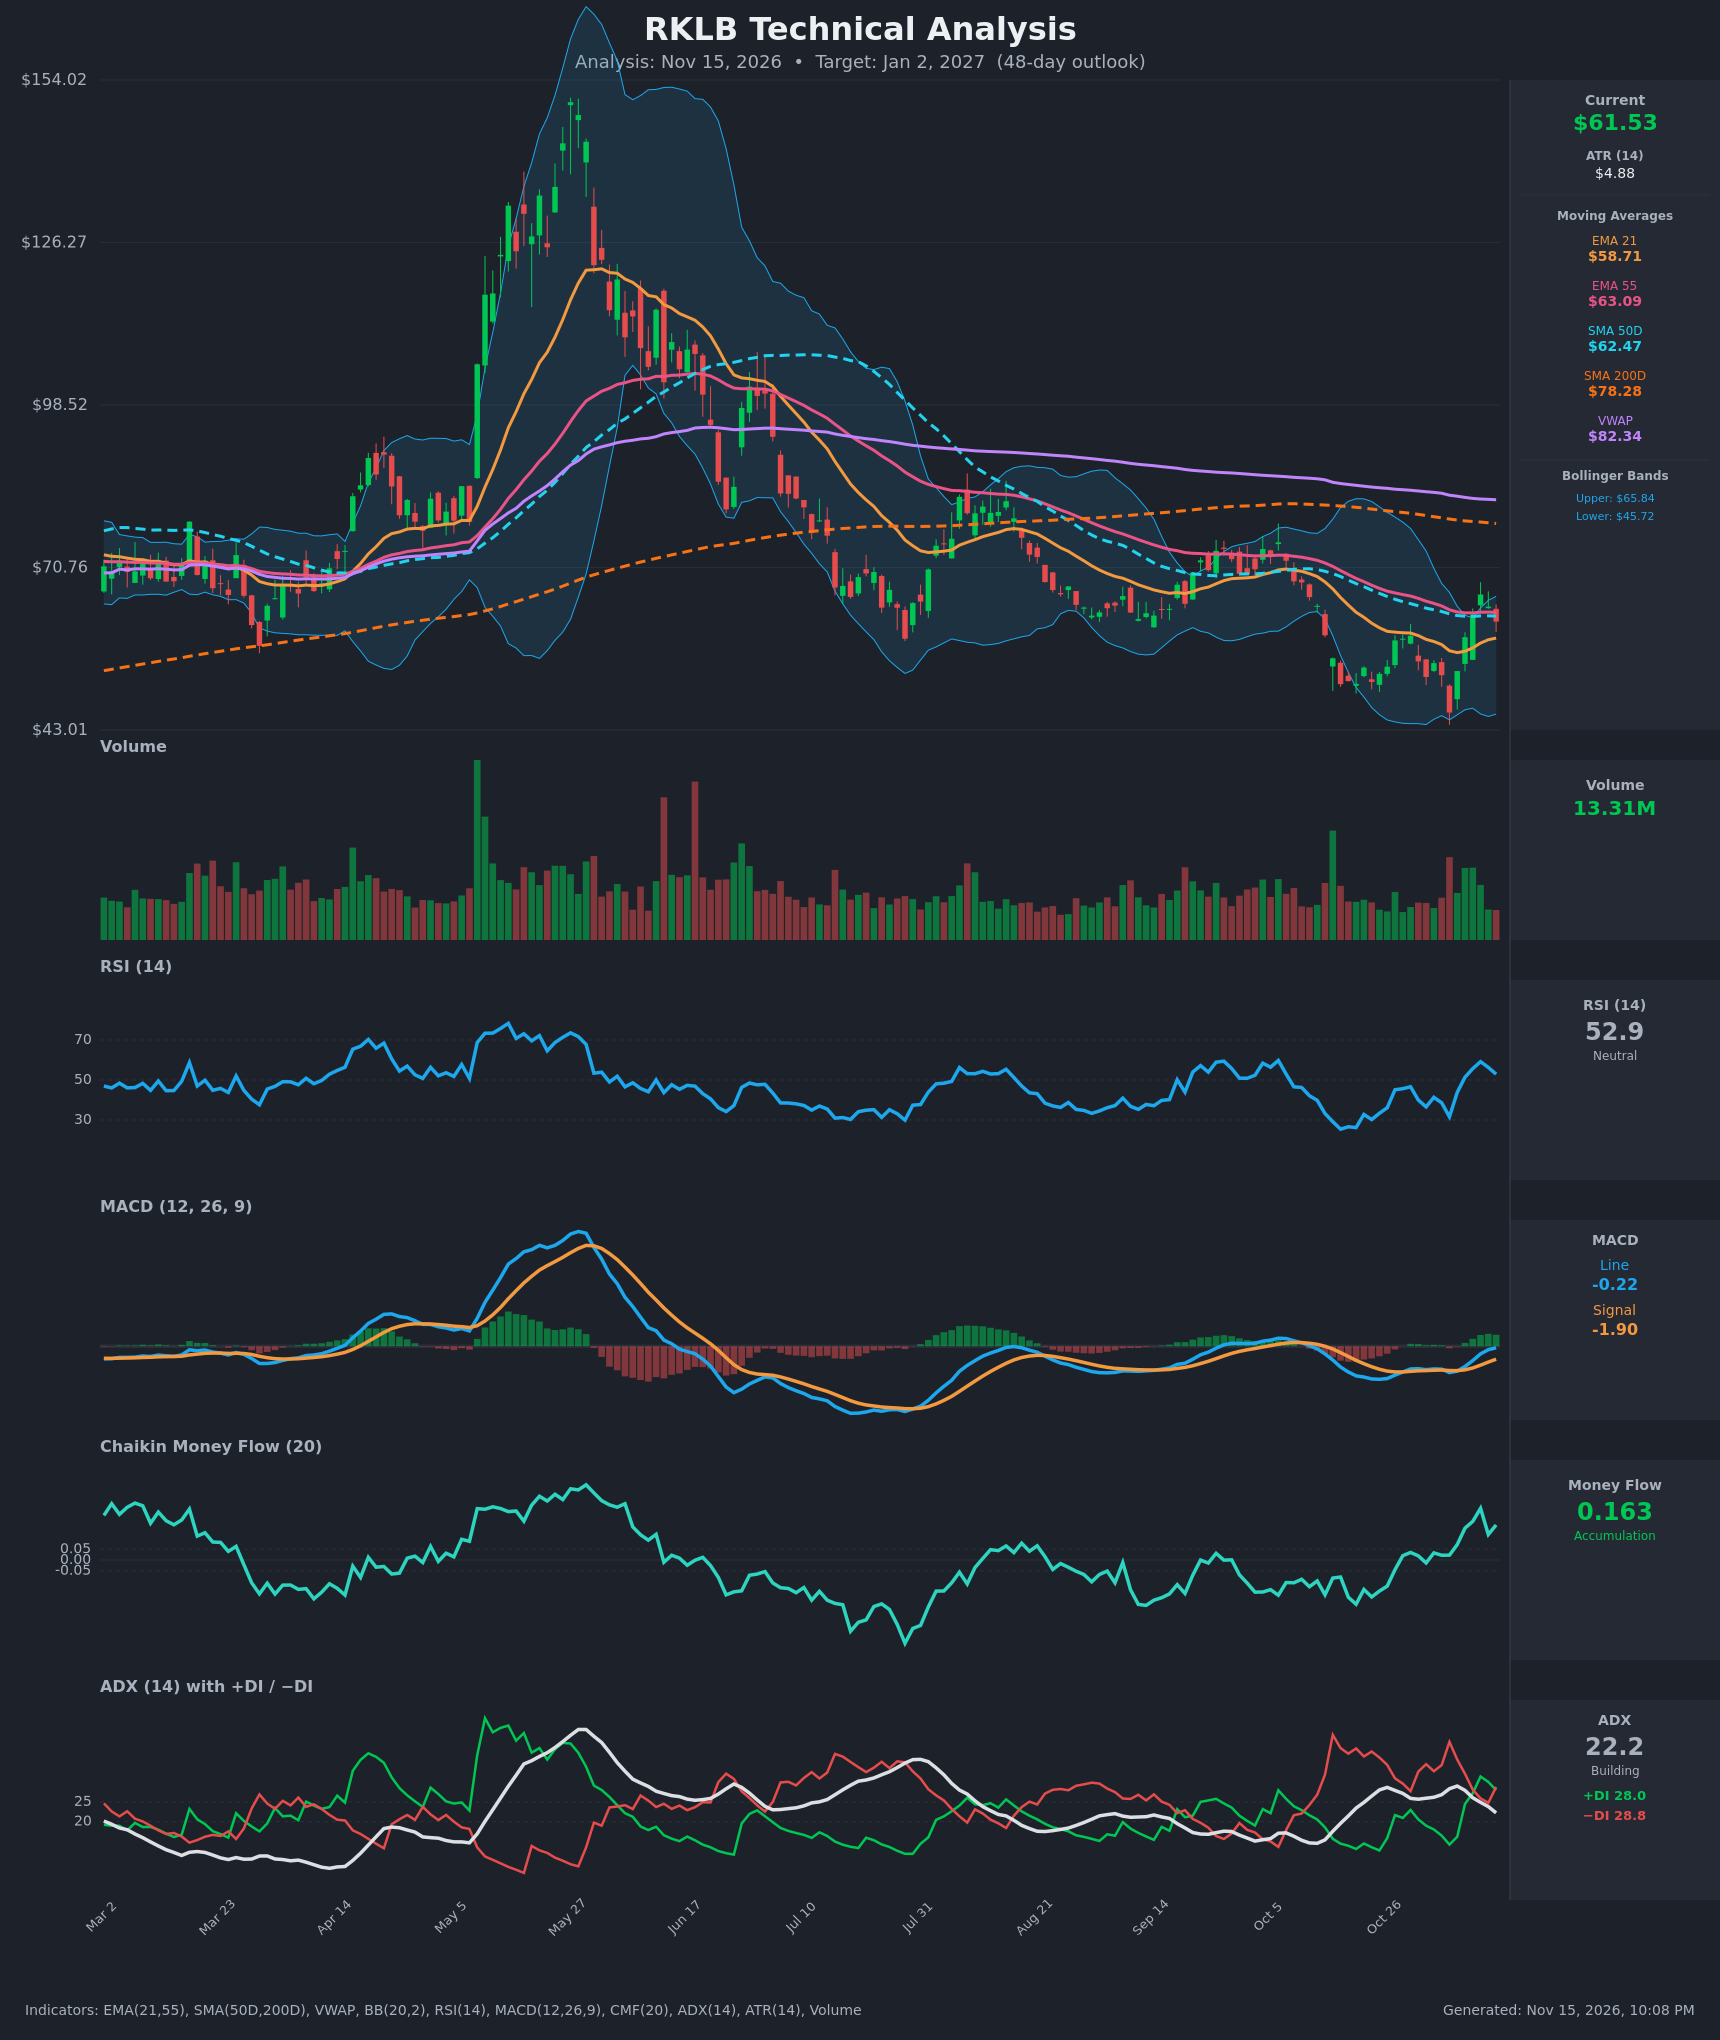
Analysis
TECHNICAL INDICATORS
- RSI (14): 52.91, down from 59.2 on Nov 11 but well up from 31.6 on Nov 5. It sits mid-range, with the oversold-bounce momentum cooling. [Neutral]
- 20 EMA (EMA 21): $58.71. Price ($61.53) is above it and the EMA has turned up from $56.23, so it is dynamic support. EMA21 is still below EMA55 ($63.09), so there is no bullish EMA cross yet. [Bullish]
- MACD: Line -0.22 vs Signal -1.90, histogram about +1.68 and expanding for five straight bars. The line is rapidly closing in on the zero line and has already moved well above the signal. This is a bullish momentum turn from deeply negative territory. [Bullish]
- Bollinger Bands (20): Upper $65.84, lower $45.72, midline about $55.78. The bands are wide after the volatile selloff. Price is in the upper half after bouncing off the lower band on Nov 5, and the Nov 11 high of $66.15 tagged the upper band. [Neutral]
- CMF (20): 0.163, above the +0.05 threshold and recovering from near zero in October. This shows genuine accumulation behind the rebound. [Accumulation]
- ADX (14): 22.2 and falling from 29.0, so there is no strong trend. +DI 28.0 vs −DI 28.8, with the bears barely on top after a fresh DI cross. The selloff trend is fading, but bulls have not taken control. [Weak Trend, direction contested]
- Volume: 13.31M, with the rebound candles (Nov 9–11) on above-average volume and the latest pullback on lighter volume. The bounce had real participation and the pullback shows no heavy distribution. [Mildly Bullish]
DIVERGENCES & TRENDS
- Price made a lower low at $45.99 (Nov 5) and RSI reached only 31.6, while the MACD histogram has since turned positive. This is momentum recovery rather than a clean divergence.
- CMF has trended up from -0.12 (Oct 26) to +0.16, ahead of price recovering its prior highs. This is a bullish accumulation trend.
- MACD has been rising for 6 sessions toward zero, and a move above the signal-line/zero-line region would confirm the turn.
- Long-term structure remains bearish:
- Price is below the SMA200 ($78.28) and VWAP ($82.34).
- SMA50 ($62.47) is below SMA200, so the death cross is already in place.
- EMA21 is below EMA55.
- The series of lower highs from the $150 peak continues.
- Overhead resistance is clustered at $62.5–$63.1 (SMA50 and EMA55), which price is testing and just rejected on Nov 13 (-4%).
- The −DI/+DI cross on Nov 13 is a minor warning, and RSI is rolling over from 59.
CHART PATTERNS
- Loose Bullish Double Bottom: lows around $46–$48 in late Oct/early Nov. The neckline near $59–$60 has been broken. The measured move (~$13 height) points to about $72, though it is not a textbook pattern.
- Larger-scale context: a Bearish Descending structure of lower highs since the May peak. The $66 area is the key level to break to invalidate it.
- Current price action sits in a consolidation/pullback just under the SMA50 and EMA55 cluster. A breakout above $66.15 would complete the bullish reversal. A rejection would keep the lower-high sequence intact.
POTENTIAL SCENARIOS
- Scenario 1: Bullish Reversal Breakout — The accumulation-backed rebound holds above the EMA21, MACD crosses toward zero, and price clears the SMA50/EMA55 cluster and the Nov 11 high. Trigger: daily close above $66.15 on rising volume. Target: $72–$75, with the SMA200 at $78 as the extended objective. Invalidation: close below $58.70 (EMA21), then $55. (45% probability)
- Scenario 2: Neutral Range Chop — Price oscillates under the $63–$66 resistance cluster and above EMA21 support while ADX stays weak. Trigger: repeated failures at $63–$66 with holds at $56–$58. Target: $56–$65 range. Invalidation: a close beyond either $66.15 or $55. (25% probability)
- Scenario 3: Bearish Lower-High Rollover — The bounce fails as a lower high under the SMA200 with the −DI dominant and the death-cross structure intact. Trigger: close below $58.70, then below $55.78 (BB midline). Target: $52, then the $46 low. Invalidation: close above $66.15. (30% probability)
PRICE TARGETS
- Target Price: $65.00 (48-day horizon, about +5.6%)
- Expected Range: $58.00 to $69.00 (width $11.00, about 17.9% of current price, consistent with the 30–60 day guidance)
- Key Levels: Support at $58.71 (EMA21), Resistance at $66.15 (Nov 11 high, near the upper Bollinger Band; minor resistance at $62.47–$63.09 from SMA50/EMA55)
OVERALL BIAS
OVERALL BIAS: BULLISH - Accumulation (CMF +0.16), a rising MACD histogram, and price holding above the rising EMA21 favor an extension of the rebound toward the mid-$60s. The overhead SMA50/EMA55/SMA200 resistance and the weak ADX keep conviction modest.
This is educational analysis and not financial advice.