RKLB 62-day bullish forecast — Nov 15, 2026
- Bias: Bullish
- Timeframe: 62 days (made Nov 15, 2026, target date Jan 15, 2027)
- Price at analysis: $61.53
- Price target: $67.50
- Expected range: $55.00 – $72.00
- Result: Pending — graded after the close on Jan 15, 2027
Get a free AI analysis of RKLB today
Analysis
TECHNICAL INDICATORS
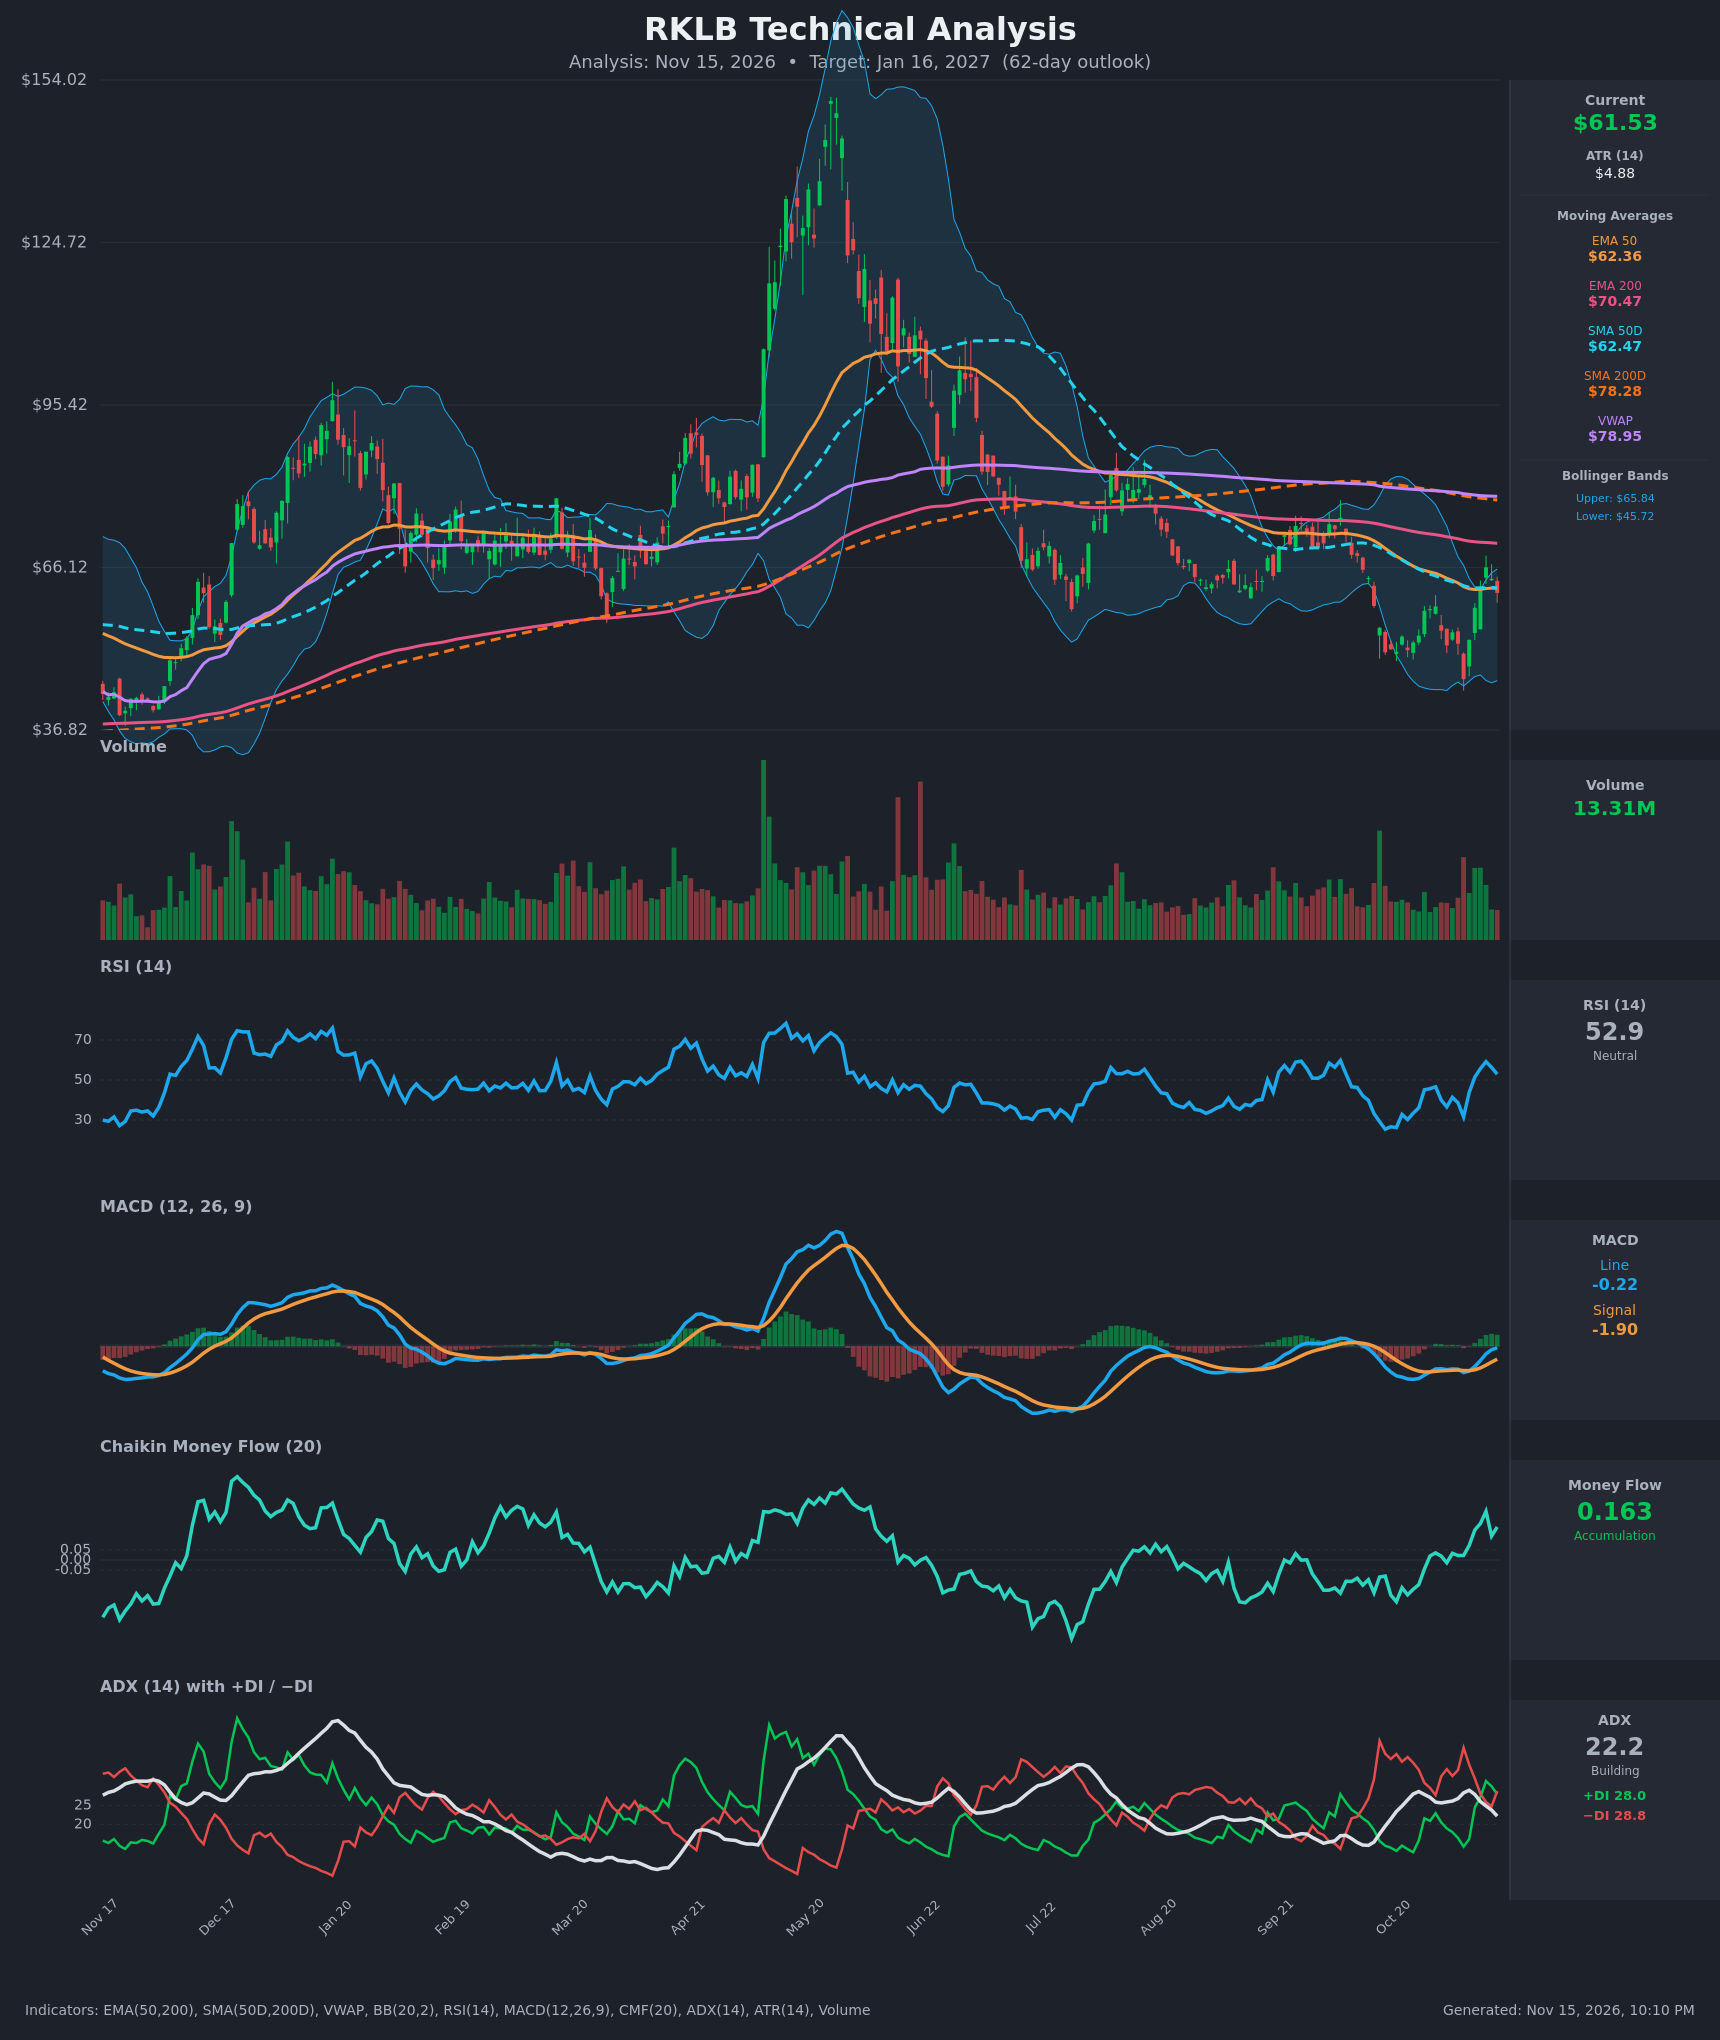
- RSI (14): 52.91, down from 59.2 on Nov 11 but well above the 31.6 low on Nov 5. It is mid-range with no overbought or oversold signal, and short-term momentum is cooling after a sharp rebound. [Neutral]
- 20 EMA: Not supplied, so I use the EMA 50 at $62.36 as the nearest trend proxy. Price ($61.53) sits just below it, and the SMA 50D ($62.47) is also just overhead. It was reclaimed on Nov 10-12 and has now been lost again, which makes this the pivot zone. EMA 200 ($70.47) is further overhead resistance. [Neutral]
- MACD: Line -0.22 is above signal -1.90, a histogram of about +1.68. The bullish crossover came around Nov 9 and the line is close to zero. The histogram is still positive, but the line's rise is flattening (-0.51 to -0.22), so the pace of improvement is slowing. [Bullish]
- Bollinger Bands (20): Upper $65.84, lower $45.72, midline about $55.78. Price is in the upper half of the bands after a rebound from below the lower band on Nov 5, and it failed near the upper band at $66.15. The bands are wide after the volatile swing. [Neutral]
- CMF (20): 0.163, well above +0.05. It has risen from -0.12 on Oct 26 and is the strongest reading in months, so buyers are accumulating during the bounce. [Accumulation]
- ADX (14): 22.2 and falling from 29.0, so the trend is weak and fading. +DI at 28.0 has just crossed below -DI at 28.8, so control is evenly balanced with a slight bearish edge. [Weak Trend, direction undecided]
- Volume: 13.31M, average to slightly above average relative to recent bars. Volume was heavier on the Nov 5-11 rebound, and the pullback is on moderate volume, which is not clearly distributional. [Neutral to mildly supportive]
DIVERGENCES & TRENDS
- Price made lows near $44-46 (Oct 30 to Nov 5). RSI on Nov 5 (31.6) held above its prior extremes (it was near 27 in late October). That is a mild bullish higher-low divergence.
- MACD crossed bullishly on Nov 9 from deeply negative territory and is approaching the zero line.
- CMF turned positive and rose through the bounce, confirming accumulation.
- ADX is falling from 29 to 22, and the +DI/-DI crossover on Nov 13 is a minor bearish signal. Trend strength is fading.
- RSI has rolled over from 59.2 to 52.9 along with three lower closes ($66.15, $64.07, $61.53), which is short-term pullback behavior.
- Long-term structure remains bearish:
- EMA 50 and SMA 50D are below EMA 200 and SMA 200D, so the death cross is already in place.
- Price is below the SMA 200D ($78.28) and VWAP ($78.95).
- The stock has dropped from the roughly $150 peak to the low $60s.
CHART PATTERNS
- Bullish Double Bottom (reversal): Lows near $44-46 (late Oct / Nov 5) with a neckline near $66, where the $66.15 high on Nov 11 was rejected. Price is retesting the area between the lows and the neckline. A confirmed close above about $66.5 would project a measured move toward $85+, but that is a stretch for 62 days, so I treat roughly $70-72 (EMA 200) as the realistic first target.
- Broader range: Since July, price has traded between about $45 and $85 below the declining 200-day averages. A rally into the $70-78 resistance cluster would likely meet heavy supply.
- A failure back below $55 would invalidate the double bottom and open a retest of the $45 lows.
POTENTIAL SCENARIOS
- Scenario 1: Bullish Double-Bottom Breakout — Price holds the $55-58 area, reclaims the $62.4 moving-average cluster, and breaks the $66 neckline on accumulation (CMF positive, MACD turning up). Trigger: daily close above $66.50 with volume. Target: $70-72 (EMA 200), with an extension toward $78 (SMA 200D). Invalidation: close below $54. (45% probability)
- Scenario 2: Bearish Rejection at the Moving Averages — The -DI/+DI crossover and the rollover from the upper Bollinger Band lead to renewed selling beneath the falling long-term averages. Trigger: close below $55.80 (Bollinger midline). Target: $48-50, near the prior lows. Invalidation: close above $66.50. (30% probability)
- Scenario 3: Neutral Chop Around $62 — The weak ADX keeps price bouncing between $55 and $66 around the flat 50-day averages. Trigger: failure to close outside $55-$66. Target: $58-65. Invalidation: a decisive close outside that range. (25% probability)
PRICE TARGETS
- Target Price: $67.50 (62-day horizon)
- Expected Range: $55.00 to $72.00 (width $17.00, about 27.6% of current price, which fits the 18-30% guidance for 61-180 days)
- Key Levels: Support at $55.80, Resistance at $66.15
OVERALL BIAS
OVERALL BIAS: BULLISH - The evidence leans modestly bullish: a double-bottom base near $45, a bullish MACD crossover, and the strongest CMF accumulation in months. The offsetting factors are the fading ADX, the minor bearish DI cross, and overhead resistance from the death-cross moving averages. Conviction is moderate, and the $66 neckline and $55 support are the key levels.
This is educational analysis and not financial advice.