RKLB 20-day bullish forecast — Nov 15, 2026
- Bias: Bullish
- Timeframe: 20 days (made Nov 15, 2026, target date Dec 4, 2026)
- Price at analysis: $61.53
- Price target: $64.50
- Expected range: $58.50 – $66.50
- Result: Pending — graded after the close on Dec 4, 2026
Get a free AI analysis of RKLB today
Analysis
TECHNICAL INDICATORS
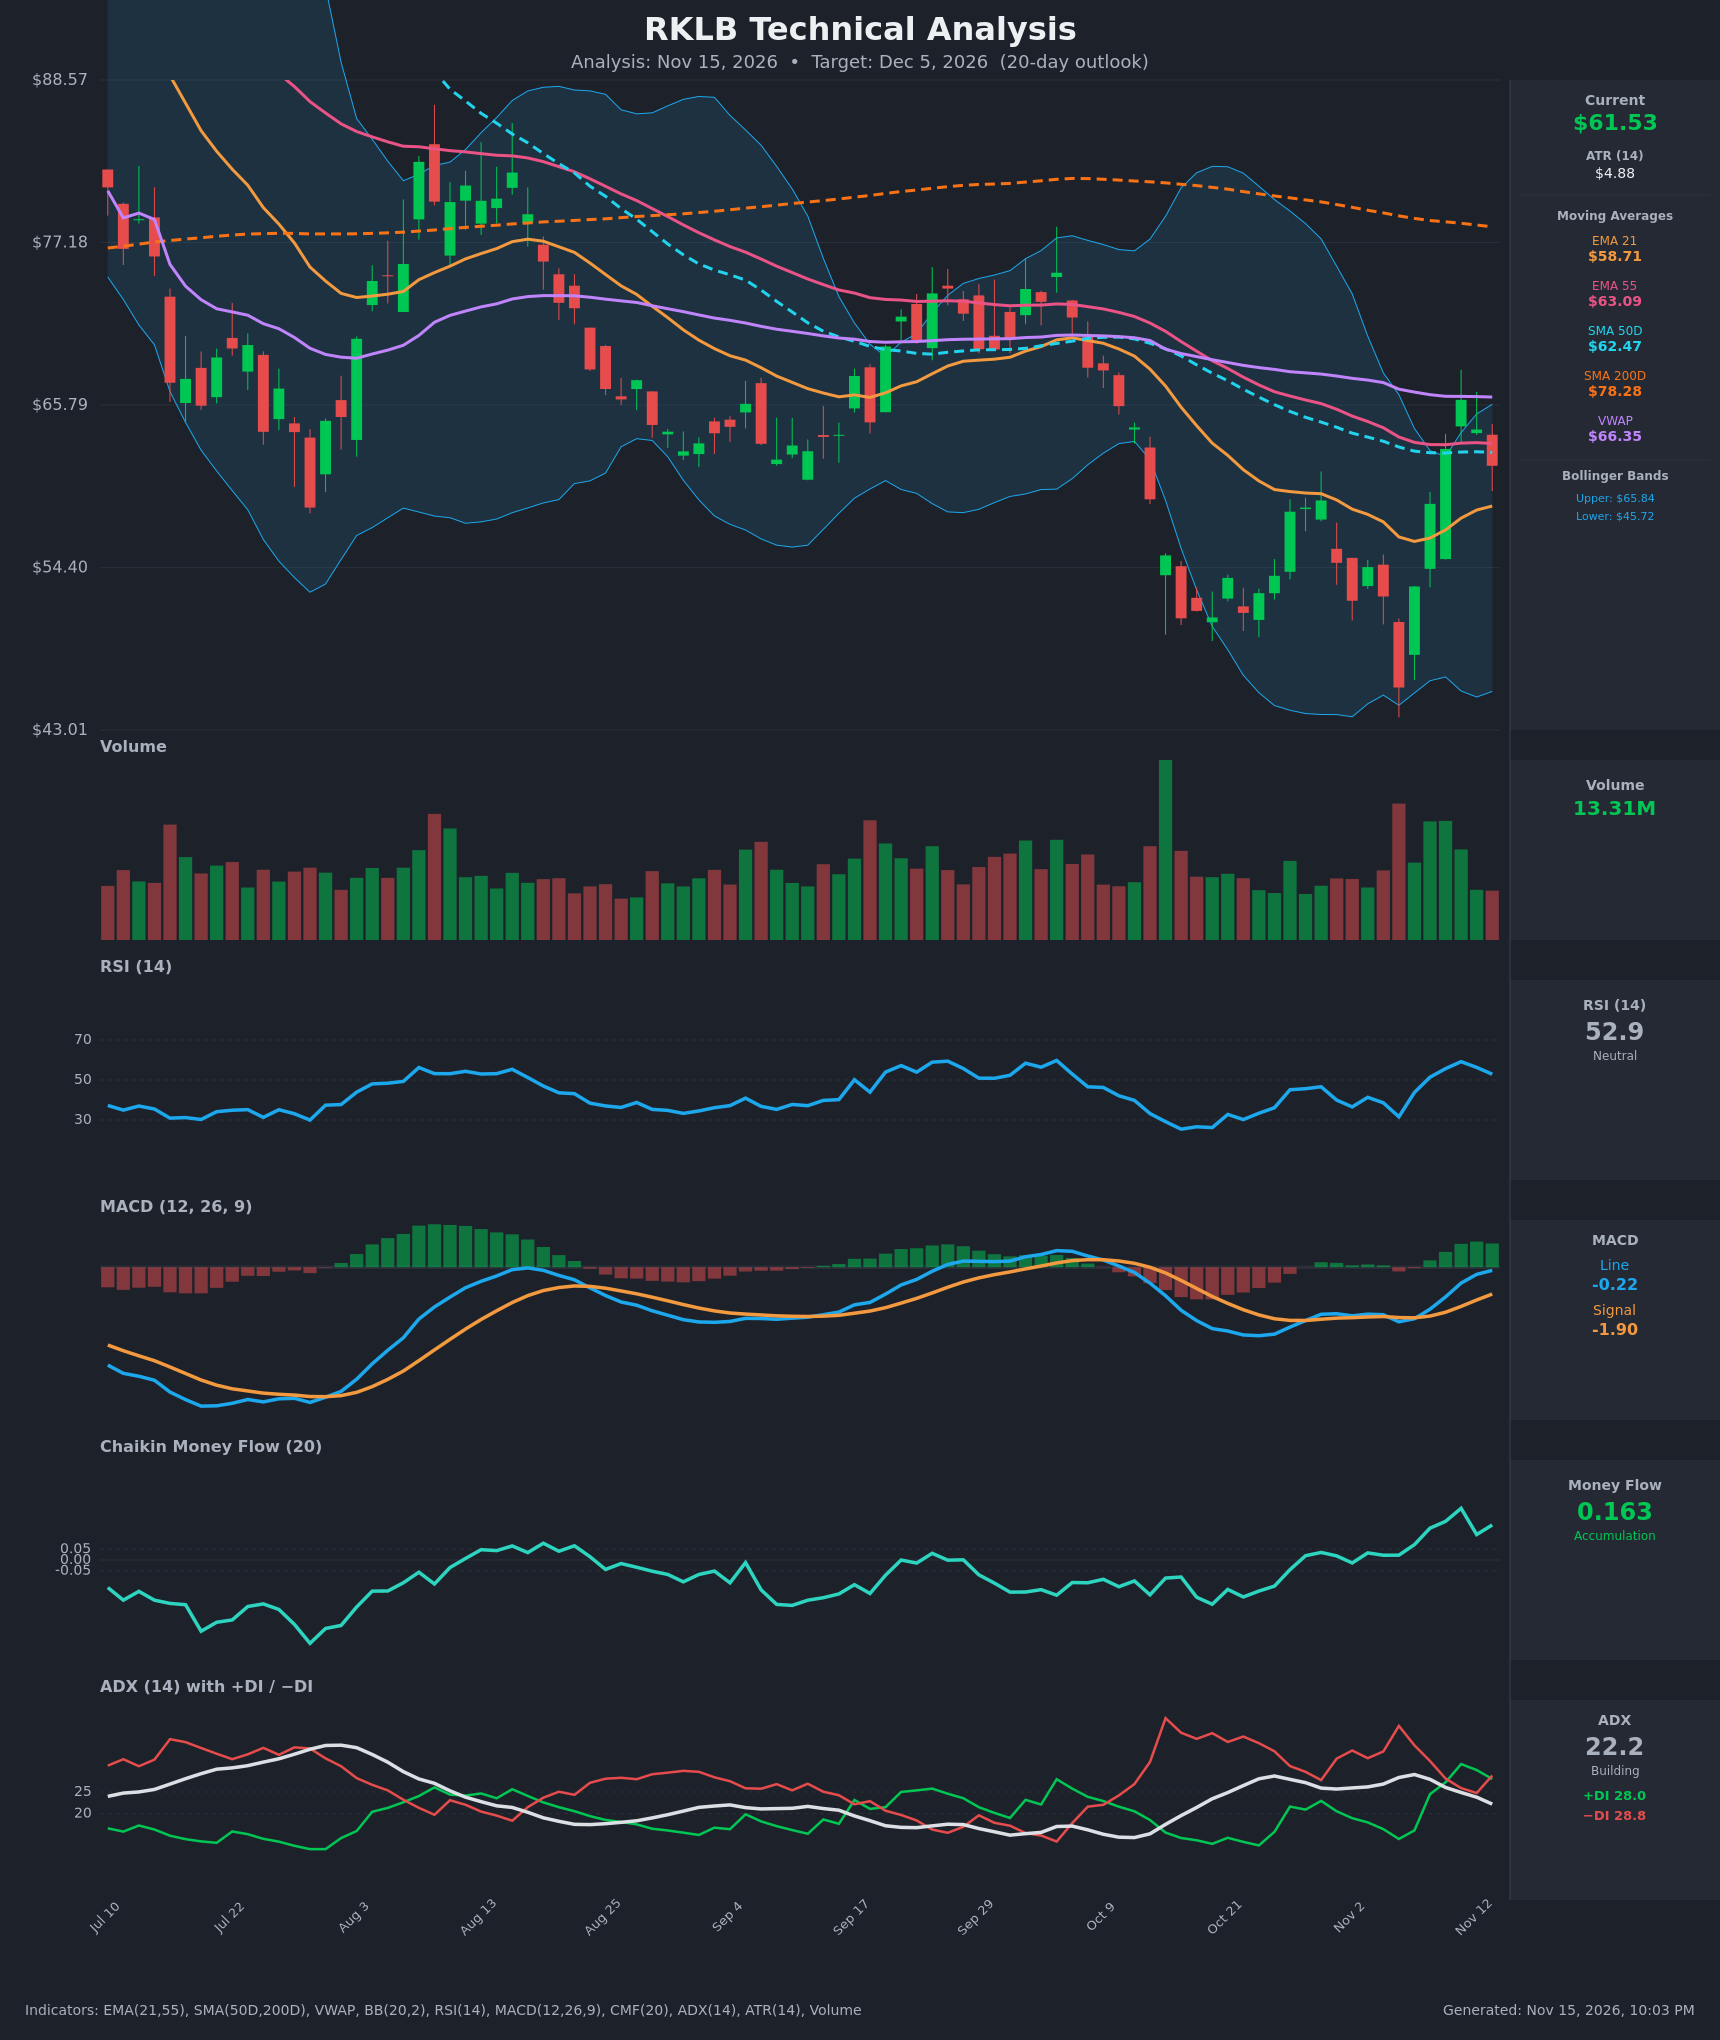
- RSI (14): 52.91, down from a 59.2 peak on Nov 11 after rising from 31.6 on Nov 5. It sits mid-range with no overbought or oversold signal. The V-shaped recovery is intact, but the last two readings show momentum cooling. [Neutral]
- 20 EMA (EMA 21): $58.71. Price at $61.53 is above it, and the EMA has turned up from $56.23. It is the first dynamic support on a pullback. [Bullish]
- MACD: Line -0.22 vs signal -1.90. The bullish crossover came around Oct 29, and the histogram has stayed positive and widening. Both lines are still below zero, so this is a recovery in momentum, not a confirmed uptrend. [Bullish]
- Bollinger Bands (20): Upper $65.84, lower $45.72, so the midline is about $55.78. Price is in the upper half of the bands after tagging the upper band on Nov 11 ($66.15) and being rejected. The bands are very wide after the volatility spike. A pullback toward the midline is possible, but price is not weak. [Neutral]
- CMF (20): 0.163, well above +0.05, and it has trended up from negative readings. Buying pressure persisted through the sell-off and rebound. [Accumulation]
- ADX (14): 22.2 and falling from 29.0, so the trend is weak and the prior downtrend is fading. +DI is 28.0 and −DI is 28.8, a near-flat spread. −DI has just re-crossed above +DI, so control is contested. [Weak Trend, Neutral/Slightly Bearish]
- Volume: 13.31M on the latest red candle, lower than the heavy green-volume bars of Nov 9–11. The rebound had strong participation and the pullback so far is on lighter volume, which is constructive. [Mildly Bullish]
DIVERGENCES & TRENDS
- Moving averages: SMA50D ($62.47) is below SMA200D ($78.28), so the death cross is in force and the long-term trend is down. EMA21 ($58.71) is below EMA55 ($63.09), but the gap has narrowed from about $6.9 to about $4.4.
- Price vs. key levels: Price is below EMA55, SMA50 and VWAP ($66.35), which form an overhead resistance cluster at $62.5–$66.4. It is above EMA21.
- MACD: The Oct 29 bullish crossover and rising histogram came while price was still making lows (Nov 5 close $45.99), which was an early bullish momentum signal that has since been confirmed.
- CMF: It has risen steadily and now sits at its highest level in the period. This is a bullish divergence versus the weak price action of late October.
- ADX/DI: The −DI spike to about 40 on Nov 5 has fully reversed and the DIs are now converging. The decline is exhausted but a new uptrend is not yet established.
- RSI: It has rolled over from 59.2 to 52.9 with the red candle. A hold above 50 would keep the recovery intact.
CHART PATTERNS
- Bullish Double Bottom (reversal): Two lows around the mid-$40s to low-$50s (late Oct/early Nov, capitulation low near $44–46 on Nov 5) were followed by a sharp rally through the $58–60 neckline area. The measured move from a ~$45 base to a ~$59 neckline points to roughly $72, but the SMA200 and the overhead averages make a full target unlikely within 20 days. A realistic objective is the $65–66 band, which is the prior high and the VWAP.
- Current pullback: The decline from $66.15 to $61.53 looks like a retest or consolidation after the thrust. A hold above EMA21 ($58.7) keeps the bullish reversal structure valid.
- Caution: The rally has stalled right under a resistance cluster (SMA50, EMA55, VWAP). A failure here would resemble a lower high inside a larger downtrend.
POTENTIAL SCENARIOS
- Scenario 1: Bullish Reversal Continuation — Price holds above EMA21 and reclaims the $62.5–$63.1 cluster (SMA50/EMA55), then retests the Nov 11 high and VWAP. Trigger: daily close above $63.10 with CMF staying above 0.10 and MACD moving toward zero. Target: $65.50–$66.50. Invalidation: daily close below $58.70. (50% probability)
- Scenario 2: Bearish Failed Rally — The bounce fails under the overhead cluster, and with ADX weak and −DI back on top, price rolls over into a lower high. Trigger: close below $58.70 (EMA21), then below $56. Target: $52–$54, with a retest of the lows if $50 breaks. Invalidation: daily close above $66.15. (35% probability)
- Scenario 3: Neutral Range Consolidation — Price chops between EMA21 and the VWAP/upper band as the ADX stays under 20. Trigger: no close beyond $58.70 or $66.15. Target: $59–$65. Invalidation: a decisive close outside that range. (15% probability)
PRICE TARGETS
- Target Price: $64.50 (20-day horizon)
- Expected Range: $58.50 to $66.50. The width is $8.00, or 13% of the current price, which matches the 14–21 day guidance and is well above a 2–3 day range.
- Key Levels: Support at $58.71 (EMA21), Resistance at $66.15 (Nov 11 high, with VWAP at $66.35). The first hurdle is the $62.47–$63.09 cluster.
OVERALL BIAS
OVERALL BIAS: BULLISH - The MACD bullish crossover, CMF accumulation at 0.163, price above a rising EMA21, and a double-bottom reversal structure outweigh the weak ADX and the overhead SMA50/EMA55/VWAP resistance. Conviction is modest because the long-term trend is still down (SMA50 below SMA200).
This is educational analysis and not financial advice.