RKLB 34-day bearish forecast — Nov 15, 2026
- Bias: Bearish
- Timeframe: 34 days (made Nov 15, 2026, target date Dec 18, 2026)
- Price at analysis: $61.53
- Price target: $59.00
- Expected range: $50.50 – $66.00
- Result: Pending — graded after the close on Dec 18, 2026
Get a free AI analysis of RKLB today
Analysis
TECHNICAL INDICATORS
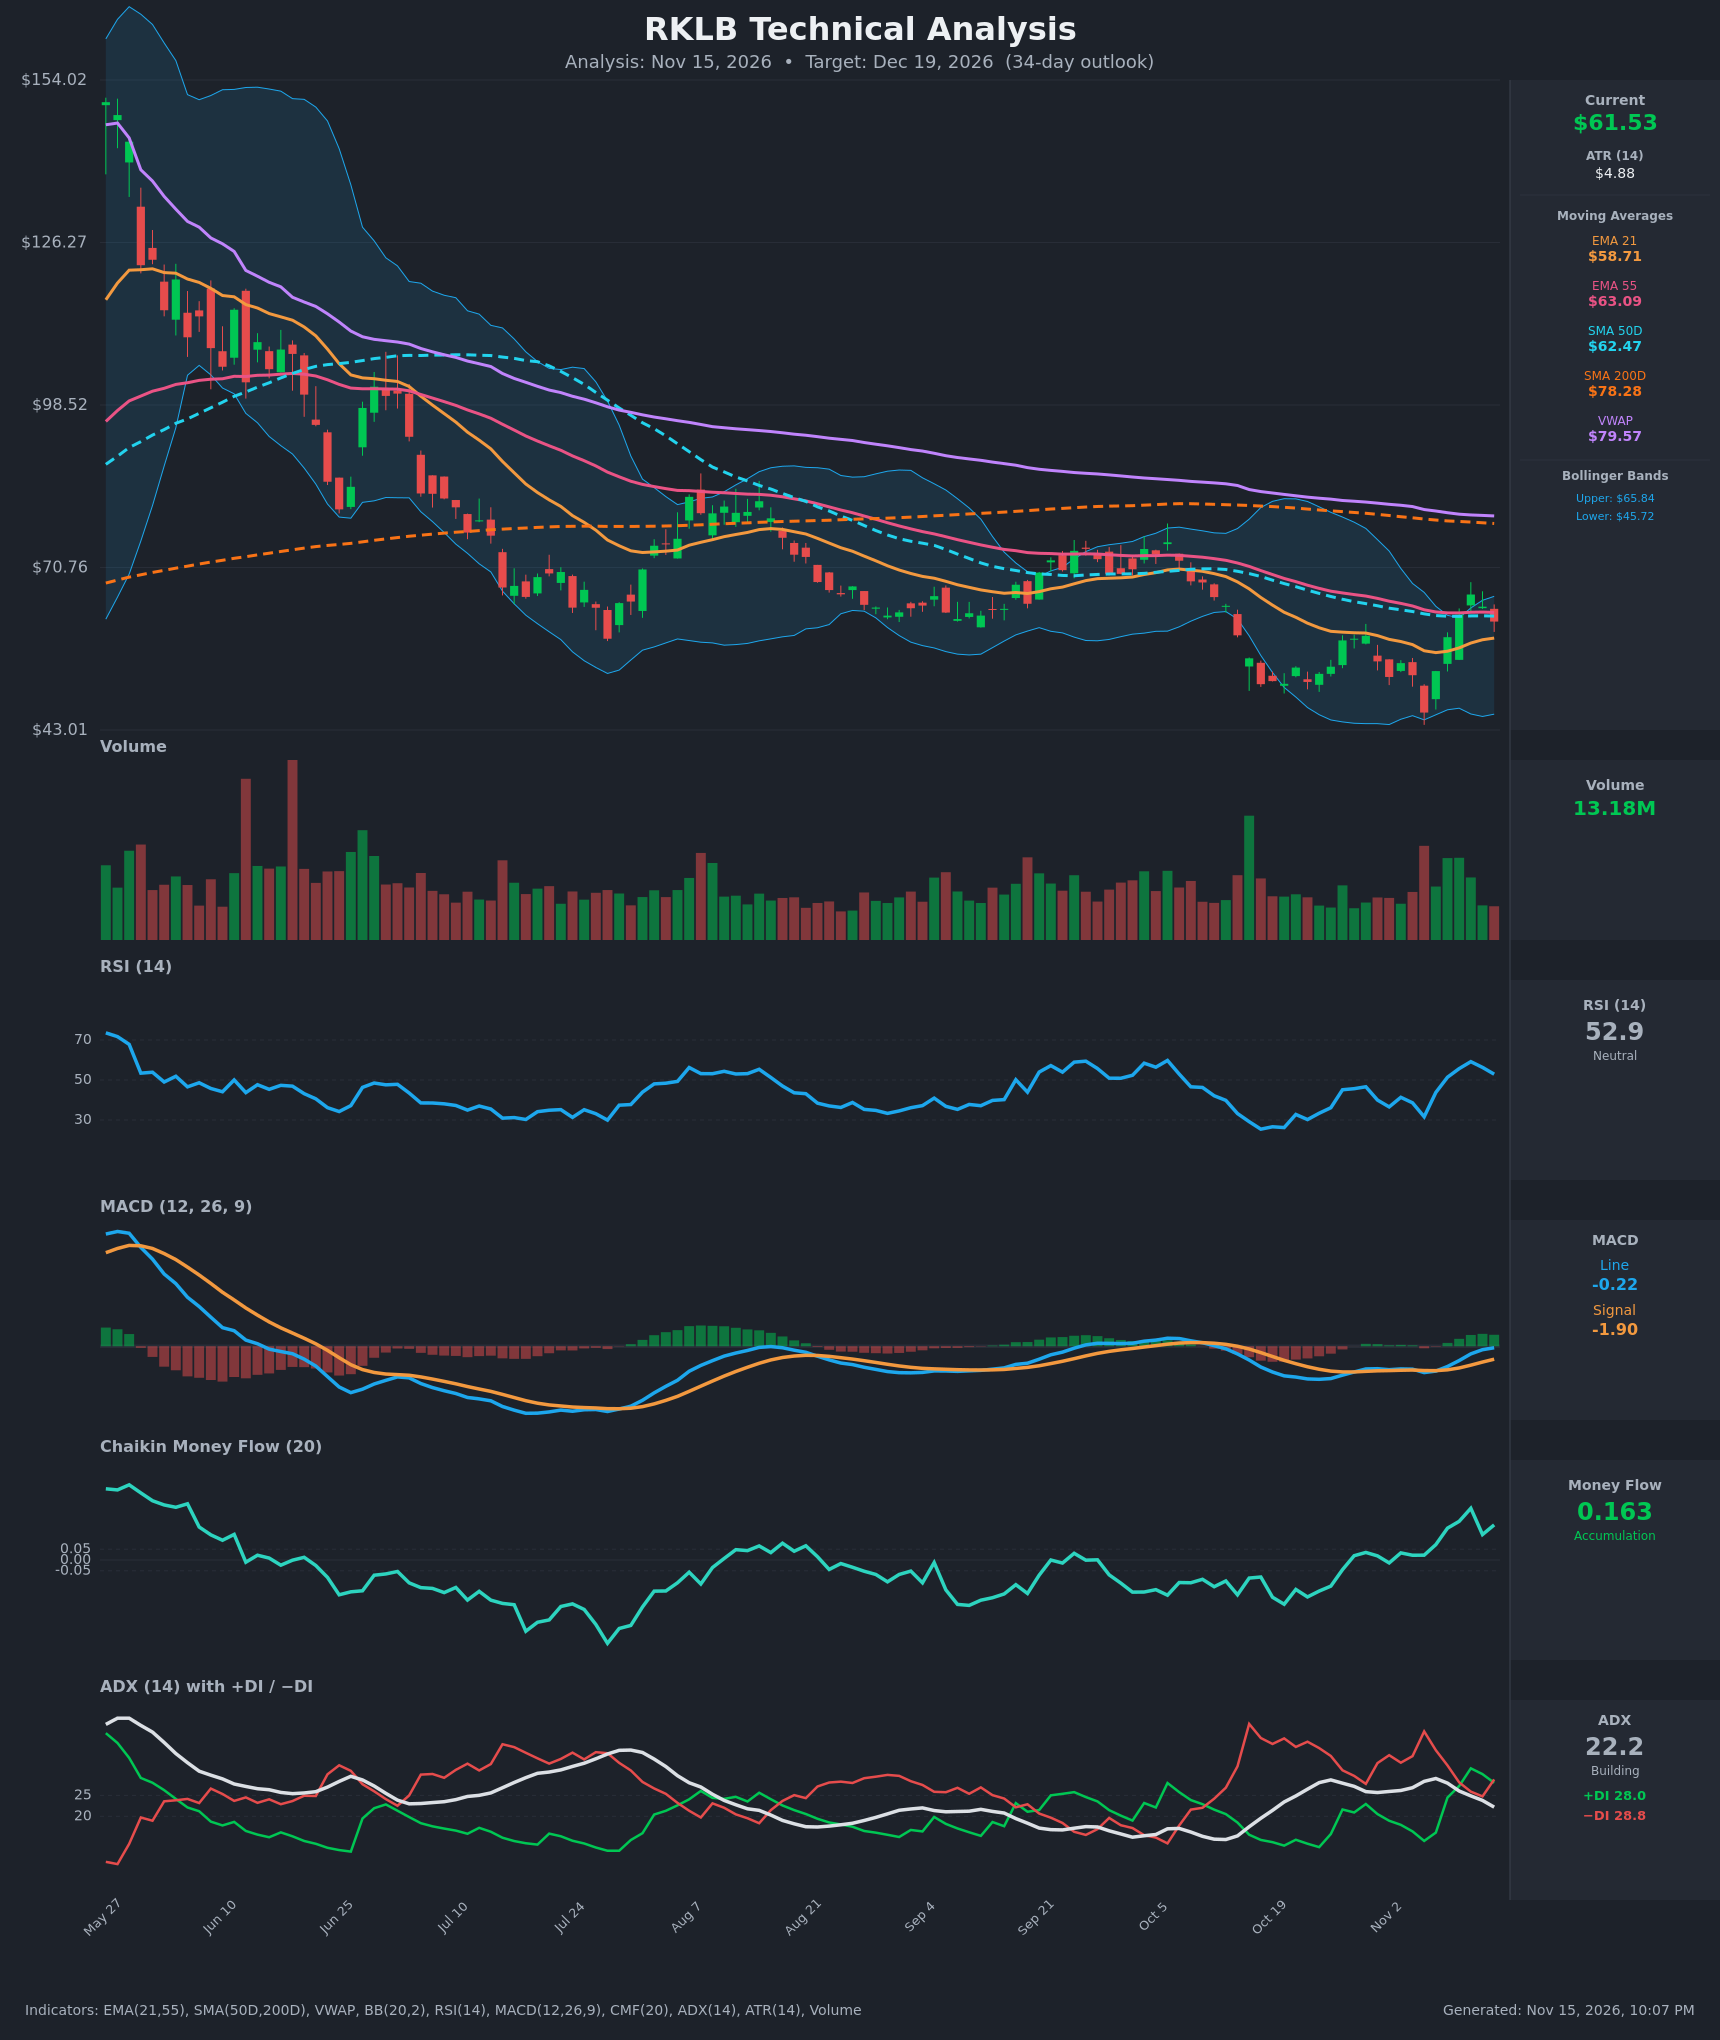
- RSI (14): 52.91, back near the midline after peaking at 59.2 on Nov 11. It has rolled over for two sessions but is still well above the 31.6 low on Nov 5. Momentum has recovered from oversold but is now fading. [Neutral]
- 20 EMA: The chart uses an EMA 21 at $58.71, and price at $61.53 is above it. The EMA is rising, so it acts as near-term support. Price sits below the EMA 55 ($63.09) and SMA50D ($62.47), which form overhead resistance. [Bullish]
- MACD: Line -0.22 against signal -1.90, so the histogram is positive (+1.68) but narrowing from its peak. The line is close to crossing zero, and the bullish crossover happened around Nov 8–9. Momentum is improving, but the latest bars show the rally slowing. [Bullish]
- Bollinger Bands (20): Upper $65.84, lower $45.72, middle about $55.8. Price is in the upper half of the bands after bouncing off the lower band on Nov 5. The bands are wide, which means high volatility. The Nov 11 high of $66.15 touched the upper band and was rejected. [Neutral]
- CMF (20): 0.163, above the +0.05 threshold and positive for several sessions, peaking at 0.240 on Nov 11. This shows accumulation during the rebound. [Accumulation]
- ADX (14): 22.2 and falling from 29.0, with +DI 28.0 against −DI 28.8. The DIs have converged and −DI is just barely on top. The trend is weak and undecided after the downtrend lost strength. [Weak Trend, directionless]
- Volume: 13.18M. Volume spiked on the Nov 5–6 flush and the Nov 9–11 rebound, then faded on the latest pullback. Buyers stepped in on the bounce, but volume is not confirming a breakout. [Neutral to mildly Bullish]
DIVERGENCES & TRENDS
- Price vs. RSI: The Nov 5 low of $45.99 came with RSI at 31.6, which is not a deep oversold reading. Earlier in the year RSI held higher lows near 27–30 while price made lower lows, a mild sign of bearish momentum exhaustion.
- Moving averages: The long-term structure is bearish. Price is far below the SMA200D ($78.28) and VWAP ($79.57), and the SMA50D remains below the SMA200D (death cross already in force). The EMA21 is converging on the EMA55 (58.71 vs 63.09), but no bullish cross has occurred.
- Reclaim attempt: Price recovered the EMA21 and is now testing the cluster of EMA55, SMA50D and the Bollinger midline/upper area around $62–66. The Nov 13 close back below $62.47 and $63.09 shows rejection.
- Indicator trends: MACD and CMF are improving, while ADX is fading and the DIs are converging. The current move is a relief rally within a larger downtrend.
CHART PATTERNS
- Bullish Falling Wedge / Double Bottom: From the reference diagram, the Oct–Nov lows near $46–49 look like a double bottom with a V-shaped recovery. The neckline is around $62–66, which is the same zone as the moving average cluster. A close above $66 would confirm it, with a measured target near $80, which is also where the SMA200D and VWAP sit.
- Larger context: The multi-month decline from $154 resembles a descending channel, or a bearish continuation of the downtrend. The structure remains a series of lower highs. Price is stuck under the descending EMA55/SMA50D.
- Near term: Price is consolidating below resistance, possibly forming a small flag or range between $56 and $66.
POTENTIAL SCENARIOS
- Scenario 1: Bullish Breakout of the Moving Average Cluster — Accumulation (CMF 0.163) and the MACD bullish turn carry price through the $62–66 resistance zone, confirming the double bottom. Trigger: daily close above $66.15 on rising volume. Target: $70–74, with $78 as an extension. Invalidation: close below $56 (EMA21 and mid-band). (35% probability)
- Scenario 2: Bearish Rejection and Range Fade — The rally stalls under the EMA55/SMA50D and the upper Bollinger Band, with −DI back on top and the MACD histogram shrinking. The downtrend resumes in a lower-high structure. Trigger: close below $58.7 (EMA21) and then $56. Target: $52, with a retest of $46–48 possible. Invalidation: close above $66.5. (40% probability)
- Scenario 3: Neutral Choppy Consolidation — Price oscillates between $55 and $65 with weak ADX. Trigger: failure to break either $66 or $55. Target: $58–63. Invalidation: close outside the $53–67 range. (25% probability)
PRICE TARGETS
For 34 days, the guidance is a range width of 12–18% of the current price. I use about 25% here because RKLB's ATR of $4.88 (about 8% of price) implies high volatility. That gives a width of $15.50 / $61.53 = 25.2%.
- Target Price: $59.00 (a modest downside drift given the bearish long-term structure, resistance overhead and fading momentum)
- Expected Range: $50.50 to $66.00
- Key Levels: Support at $56.00 (just below EMA21 at $58.71, and the mid-band), Resistance at $66.15 (Nov 11 high and upper Bollinger Band)
OVERALL BIAS
OVERALL BIAS: BEARISH - Price is stuck beneath the EMA55, SMA50D, SMA200D and VWAP in a long-term downtrend, and the relief rally is stalling at resistance with RSI and the MACD histogram rolling over and the DIs converging with −DI slightly ahead. Positive CMF and the bullish MACD crossover limit conviction, so I expect a modest pullback toward $59.
This is educational analysis and not financial advice.