RKLB 4-day bearish forecast — Nov 1, 2026
- Bias: Bearish
- Timeframe: 4 days (made Nov 1, 2026, target date Nov 4, 2026)
- Price at analysis: $54.72
- Price target: $53.90
- Expected range: $52.80 – $56.00
- Result: Correct (-4.5%) — closed at $52.25 on Nov 4, 2026; quality score 82/100
Get a free AI analysis of RKLB today
Analysis
TECHNICAL INDICATORS
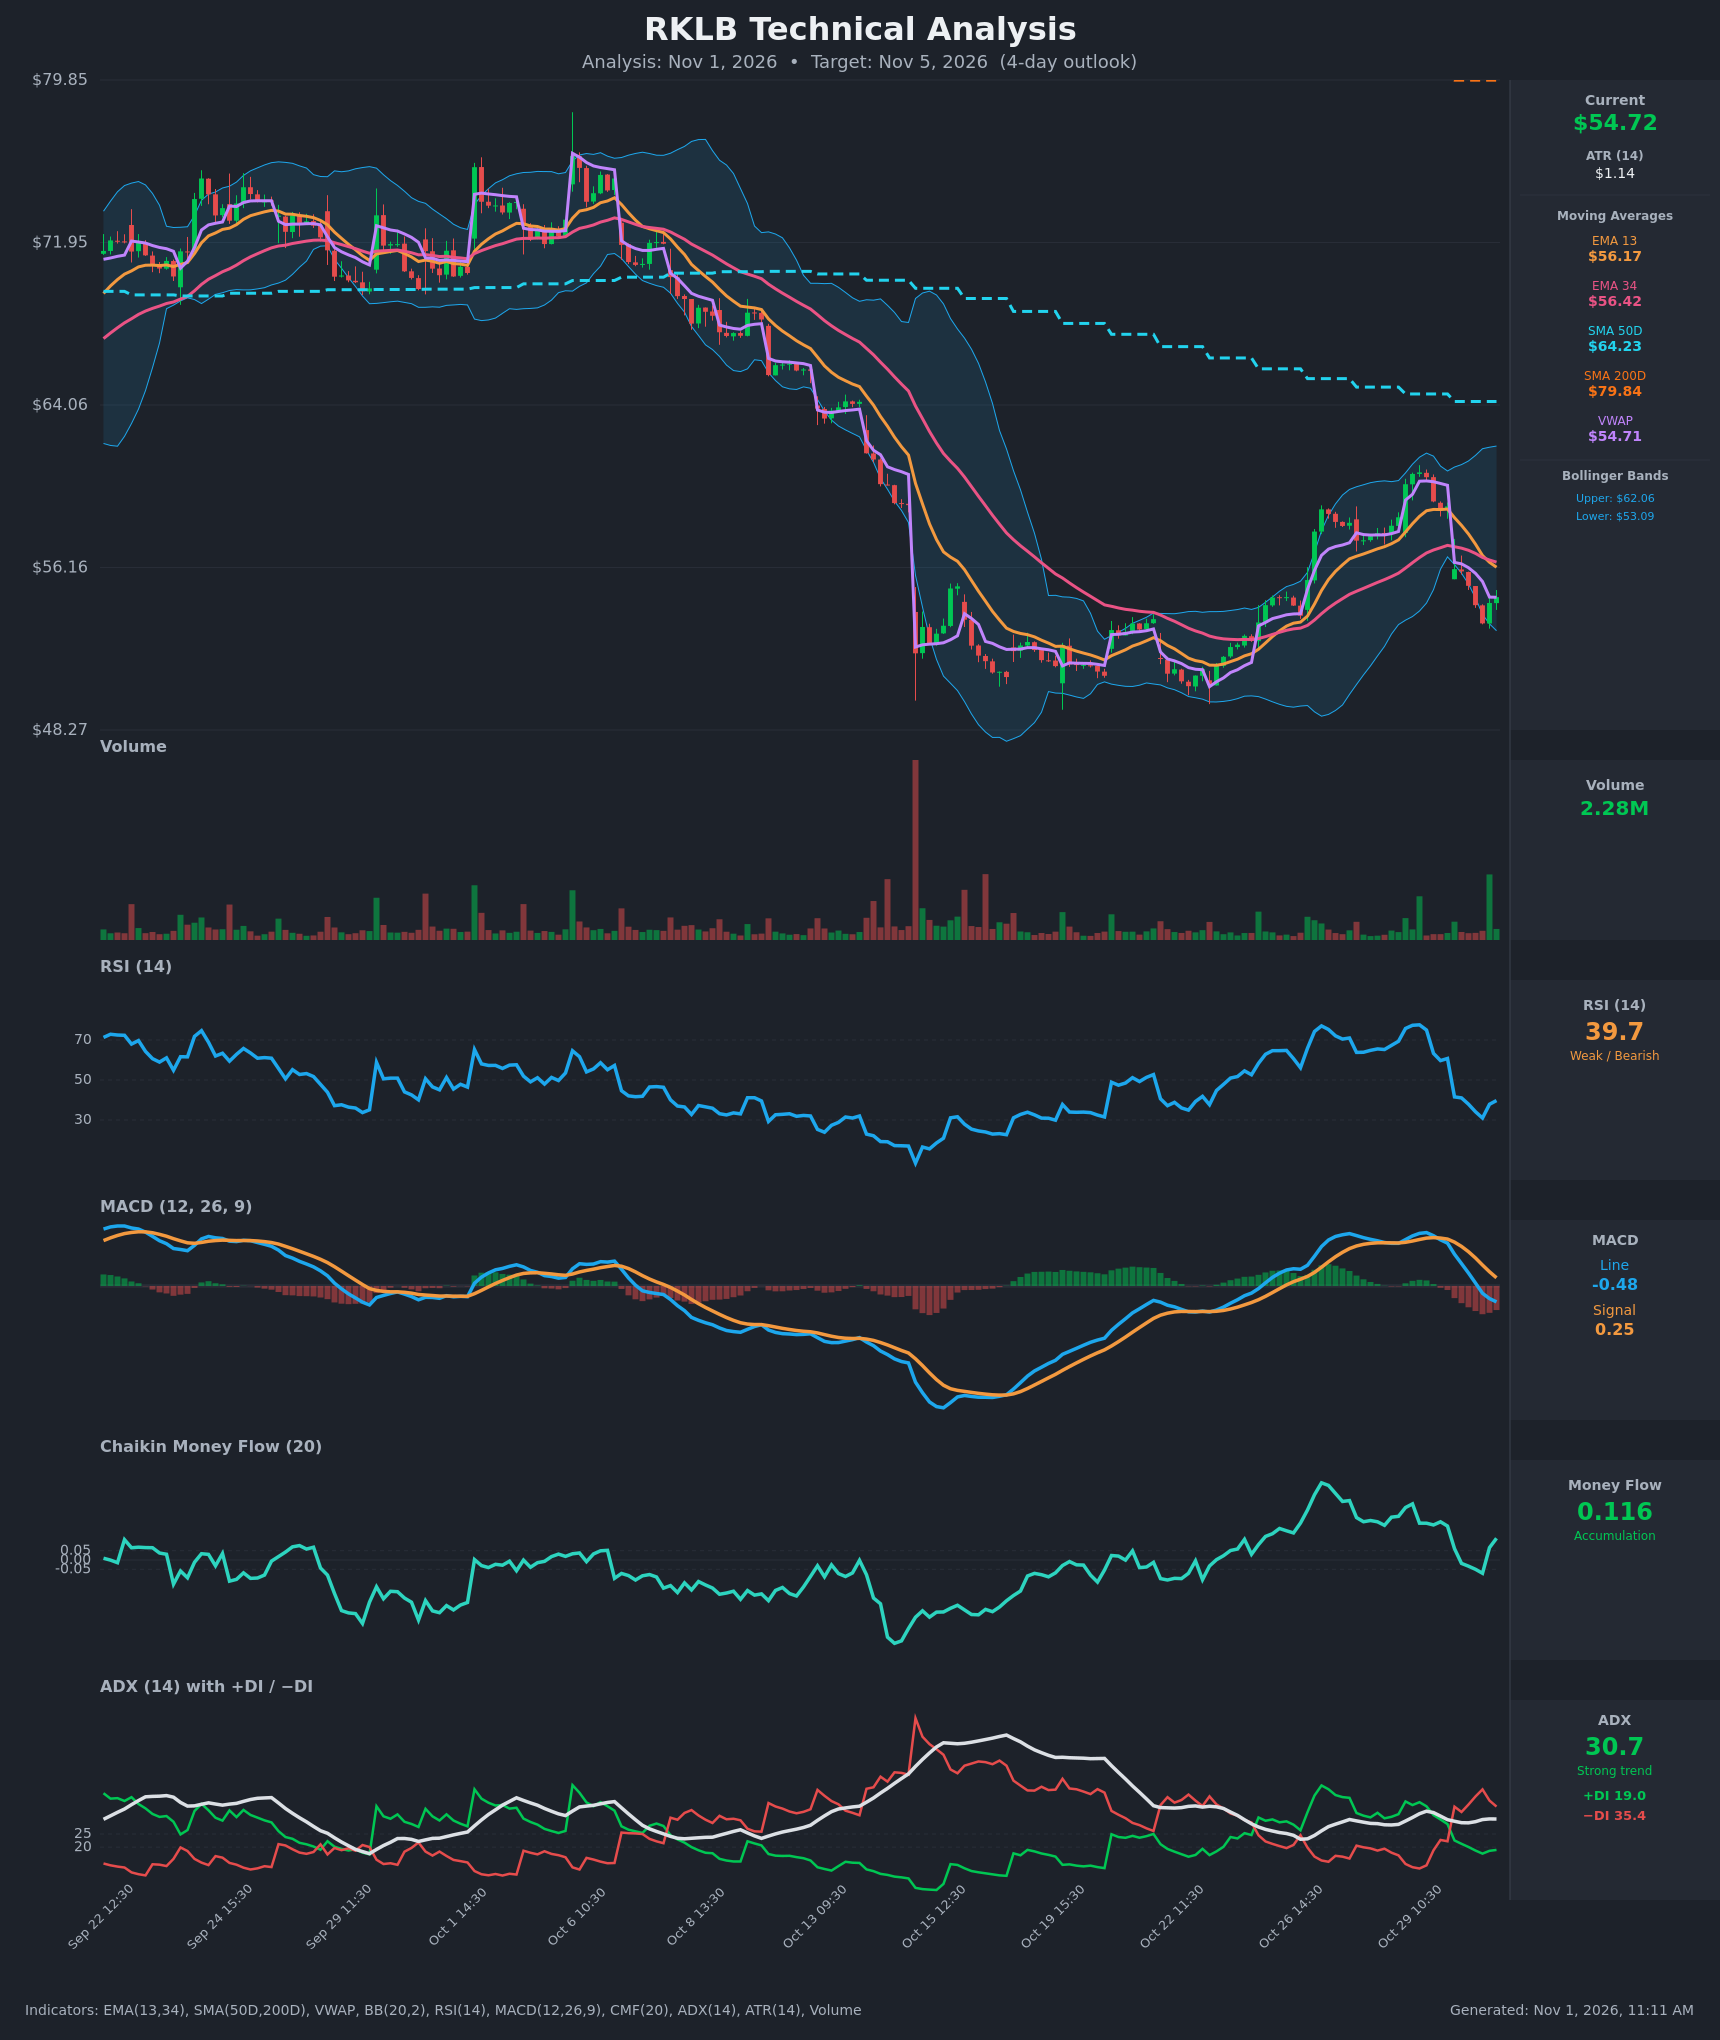
- RSI (14): 39.73. It collapsed from 77 on Oct 29 to a low near 31 on Oct 30 and has bounced to about 40. That is below 50 and under-recovered, with no oversold reading to support a reversal. [Bearish]
- 20 EMA: The data gives EMA 13 at $56.17 and EMA 34 at $56.42, which I use in place of the 20 EMA. Price at $54.72 is below both, and EMA13 has crossed below EMA34 (about 13:30–14:30 on Oct 30). Both averages are now overhead resistance, roughly $1.45–1.70 above price. [Bearish]
- MACD: Line -0.48 is below signal +0.25, and the histogram is negative at about -0.73. The line crossed below the signal around Oct 29 15:30–Oct 30 and has gone negative. Momentum is still falling, though the pace of decline is slowing slightly. [Bearish]
- Bollinger Bands (20): Upper $62.06, lower $53.09, so price sits near the lower band (about 18% of the band width). The bands are wide after the recent volatility. Price is walking the lower half after being rejected near the upper band at about $61. A bounce toward the mid-band (about $57.6) is possible, but the band-walk favors weakness. [Bearish]
- CMF (20): +0.116, an uptick from -0.07 at the low. Positive readings mean buying pressure and show dip-buying on the bounce, but the earlier +0.2–0.3 readings have faded. [Accumulation]
- ADX (14): 30.7 with -DI at 35.4 above +DI at 19.0. The trend is strong, with sellers firmly in control after the DI flip on Oct 30. ADX is flat to slightly rising rather than fading. [Strong Trend – Bearish]
- Volume: The latest bar is 2.28M, one of the larger recent bars, and it is green on the bounce off $53.45. That hints at some buying interest near the lower band. The breakdown bars on Oct 30 were also heavy, and the largest spike on the chart was the Oct 15 capitulation. Overall volume is mixed. [Neutral to Slightly Bullish]
Other context:
- VWAP is $54.71, essentially equal to price, so price is at fair value for the session with no edge.
- SMA50D is $64.23 and SMA200D is $79.84, and price is far below both, which confirms a long-term downtrend.
- SMA50D is well below SMA200D, so a death cross is already in place.
DIVERGENCES & TRENDS
- No clear divergence. The RSI low near 31 matched the price low of $53.45, and the later bounce is modest.
- CMF turned positive on the bounce while MACD and DI remain bearish. This is a minor short-term conflict that argues for a limited relief rally, not a trend reversal.
- The Oct 22–29 rally (from about $50.5 to $61) was fully rejected at the upper Bollinger Band. RSI peaked at 77.6 (overbought) and then dropped sharply, which was a classic exhaustion signal. Price has since retraced roughly 70% of that rally.
- The MACD bearish crossover and the EMA13/EMA34 bearish cross both occurred in the last two sessions. Together with the DI flip, they mark a short-term trend change back to down.
- Price is back in the lower half of the Bollinger range, which is below the VWAP/EMA cluster and under all major moving averages.
CHART PATTERNS
- Bearish Flag / Pennant (tentative): The sharp drop from about $60.7 to $53.45, followed by a small bounce, resembles the start of a bearish flag. It is not confirmed yet. A rejection around the $55.5–56.2 EMA zone followed by a break below $53.45 would project toward about $50.5, the prior Oct low.
- Failed Double Bottom continuation (context): The late-October base near $50–51 produced a rally that failed at the upper band. The structure is now lower highs ($61) after a prior downtrend from about $76, which keeps the larger bias bearish.
- No reversal pattern is confirmed. A bullish alternative would be a higher low near $53.1–53.5, which is only a basic support test at this stage.
POTENTIAL SCENARIOS
- Scenario 1: Bearish Continuation Lower — Price bounces weakly into the EMA13/34 zone, gets rejected, and rolls over with -DI dominance intact and MACD still falling. Trigger: break below $53.45 (Oct 30 low) and the $53.09 lower band. Target: $52.00–53.50, with an extension toward $50.50 if the flag breaks. Invalidation: a hourly close above $56.50. (45% probability)
- Scenario 2: Bullish Relief Bounce — Positive CMF, a high-volume green bar, and RSI turning up from near 30 fuel a recovery toward the EMAs and mid-band. Trigger: a close above $56.20 (EMA13). Target: $57.50–58.00. Invalidation: a break back below $53.45. (35% probability)
- Scenario 3: Neutral Chop Around VWAP — Price oscillates between the lower band and the EMA cluster as momentum and money flow offset each other. Trigger: no break of $53.45 or $56.20. Target: $54.00–55.80. Invalidation: any close outside $53.00–56.50. (20% probability)
PRICE TARGETS
- Target Price: $53.90 (4-day, around Nov 5)
- Expected Range: $52.80 to $56.00. The width is $3.20, about 5.8% of the current price, which fits a 4-day window (wider than a 2–3 day range, narrower than a 7–10 day one).
- Key Levels: Support at $53.09 (lower Bollinger Band; Oct 30 low is $53.45), Resistance at $56.17 (EMA13, with EMA34 at $56.42).
OVERALL BIAS
OVERALL BIAS: BEARISH - Price is below the EMA13/34, MACD has crossed bearish, and -DI (35.4) is far above +DI (19.0) with ADX at 30.7. Price is also well below SMA50D and SMA200D. Positive CMF and a possible bounce limit conviction, so the expected downside is modest, toward the $53 lower band.
This is educational analysis and not financial advice.