QBTS 6-day bearish forecast — Nov 1, 2026
- Bias: Bearish
- Timeframe: 6 days (made Nov 1, 2026, target date Nov 6, 2026)
- Price at analysis: $10.64
- Price target: $10.35
- Expected range: $10.00 – $10.80
- Result: Correct (+0.3%) — closed at $10.68 on Nov 6, 2026; quality score 95/100
Get a free AI analysis of QBTS today
Analysis
TECHNICAL INDICATORS
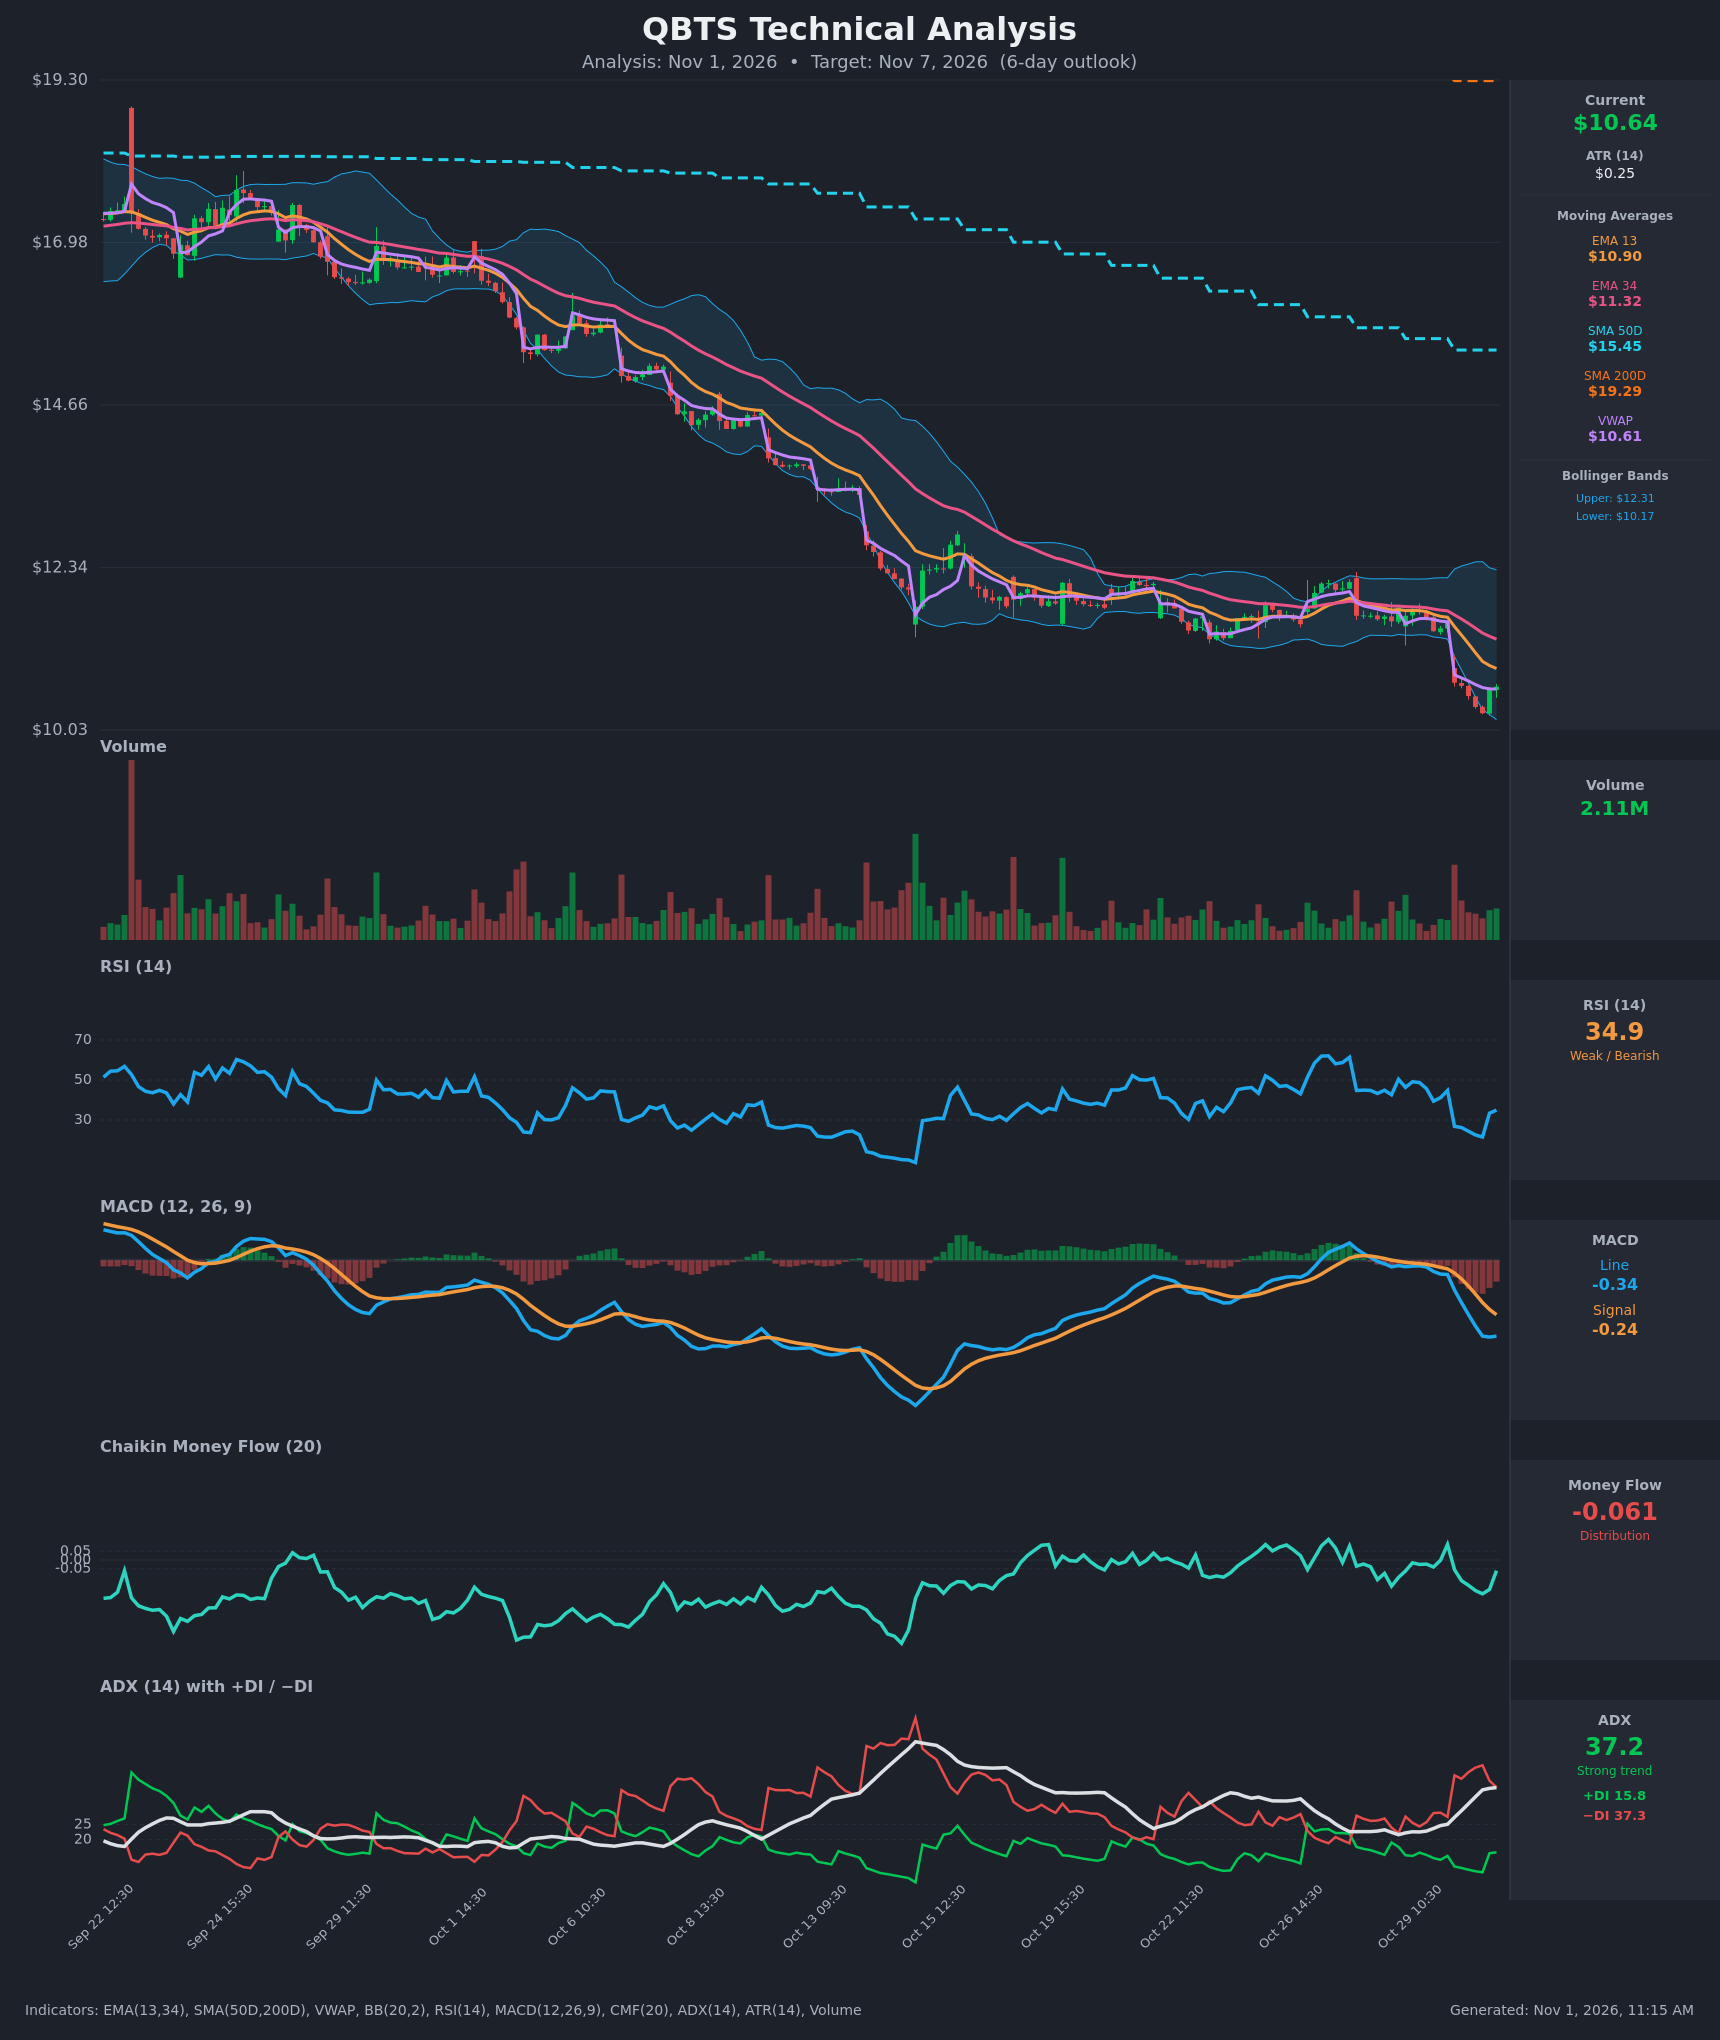
- RSI (14): 34.95. It bounced from a deeply oversold 21.5 an hour or two earlier, but is still below 40 and capped under 50. The bounce is a relief move, not yet a momentum reversal. [Bearish]
- 20 EMA (13/34 used): EMA13 is $10.90 and EMA34 is $11.32. Price at $10.64 is below both, and EMA13 is below EMA34 with a widening gap. Both now act as overhead resistance. [Bearish]
- MACD: Line -0.339, signal -0.243, so the line is below the signal with a negative histogram of about -0.10. The line flattened in the last two bars (-0.343 to -0.339), which hints at momentum stabilizing, but there is no bullish crossover. [Bearish]
- Bollinger Bands (20): Upper $12.31, lower $10.17, so price sits in the lower quarter of the bands, about $0.47 above the lower band. The bands are widening after the gap-down. Price is bouncing off the lower band, which favors a short-term relief rally, but the band-walk pattern is intact. [Bearish]
- CMF (20): -0.061, just past the -0.05 distribution threshold. It has improved from -0.193, so selling pressure is easing, but it remains in distribution. [Distribution]
- ADX (14): 37.2 and rising, with -DI at 37.3 against +DI at 15.8. This is a strong downtrend with bears firmly in control. +DI has ticked up from 9 to 15.8, but the gap is still very wide. [Strong Trend - Bearish]
- Volume: 2.11M on the latest bar, with the heaviest volume on the Oct 30 gap-down open. Rebound volume is moderate and not showing capitulation or a surge of buyers. [Selling-driven breakdown, tepid rebound]
DIVERGENCES & TRENDS
- Price vs. RSI: No bullish divergence. The RSI low of 21.5 matches the prior oversold extremes seen mid-October, and the price low is lower than those lows, so there is no clear reversal signal. The RSI bounce is a normal oversold reaction.
- MACD: It rolled over below the signal line in the Oct 29-30 sessions and is at the lowest levels since the mid-October trough. Momentum is bearish, although the line is flattening.
- CMF: It is rising from -0.193 toward -0.06, a mild improvement that could support a short-term bounce.
- ADX/DI: −DI spiked above 40 and +DI collapsed to ~9 during the gap-down. The DI spread is narrowing slightly (about 21 points), suggesting the selling impulse is cooling.
- Moving averages: SMA50D ($15.45) is far below SMA200D ($19.29), a long-standing death cross. Price is far under both, and the EMA13/34 bearish cross is intact. Price is also right at VWAP ($10.61), a pivot for the next few sessions.
- Trend: A staircase of lower highs and lower lows since mid-September, with each consolidation breaking down.
CHART PATTERNS
- Consolidation breakdown (Bearish Triple Top / range-top analog): Price chopped sideways around $11.2-$12.2 for about two weeks, then gapped down through the base on Oct 30. The measured move (~$1.0 range height from ~$11.2) points to roughly $10.2, which was nearly met at the Oct 30 low.
- Bearish continuation structure: The repeated pause-then-drop sequence resembles bearish flag/pennant continuation setups. After a bounce toward the broken range, the next leg lower could extend toward $10.00 and below.
- Relief-rally risk: Price touching the lower Bollinger Band with RSI near 21 favors a retest of broken support (the EMA13 area near $10.90) before sellers re-engage.
POTENTIAL SCENARIOS
- Scenario 1: Bearish Trend Continuation — The bounce stalls at VWAP/EMA13 and sellers push price back to the Oct 30 lows and the lower Bollinger Band. ADX above 35 with −DI dominance supports further downside. Trigger: rejection at $10.90 or a hourly close below $10.40. Target: $10.20-$10.35, with a stretch to $10.00. Invalidation: daily close above $11.30 (EMA34). (50% probability)
- Scenario 2: Bullish Oversold Relief Bounce — The oversold RSI, improving CMF and flattening MACD fuel a short-covering rally into the broken range. Trigger: hourly close above $10.90 (EMA13) with rising volume. Target: $11.20-$11.35 (EMA34 and the broken support area). Invalidation: loss of $10.20. (30% probability)
- Scenario 3: Neutral Basing Chop — Price consolidates between the Oct 30 low and EMA13 while indicators reset. Trigger: failure of both the $10.20 and $10.90 levels to break. Target: $10.45-$10.80. Invalidation: a decisive close outside the $10.17-$10.90 range. (20% probability)
PRICE TARGETS
- Target Price: $10.35 (6-day horizon)
- Expected Range: $10.00 to $10.80. The width is $0.80, or about 7.5% of the current price, which fits the 6-day timeframe.
- Key Levels: Support at $10.17 (lower Bollinger Band / Oct 30 low area), Resistance at $10.90 (EMA13, followed by EMA34 at $11.32)
OVERALL BIAS
OVERALL BIAS: BEARISH - ADX of 37 with −DI far above +DI, price below every moving average, MACD under its signal line and CMF in distribution all point to trend continuation. A relief bounce toward $10.90 is likely along the way, but sellers should reassert control and push price toward the $10.35 area.
This is educational analysis and not financial advice.