QBTS 34-day bearish forecast — Nov 15, 2026
- Bias: Bearish
- Timeframe: 34 days (made Nov 15, 2026, target date Dec 18, 2026)
- Price at analysis: $9.56
- Price target: $8.10
- Expected range: $7.00 – $11.00
- Result: Pending — graded after the close on Dec 18, 2026
Get a free AI analysis of QBTS today
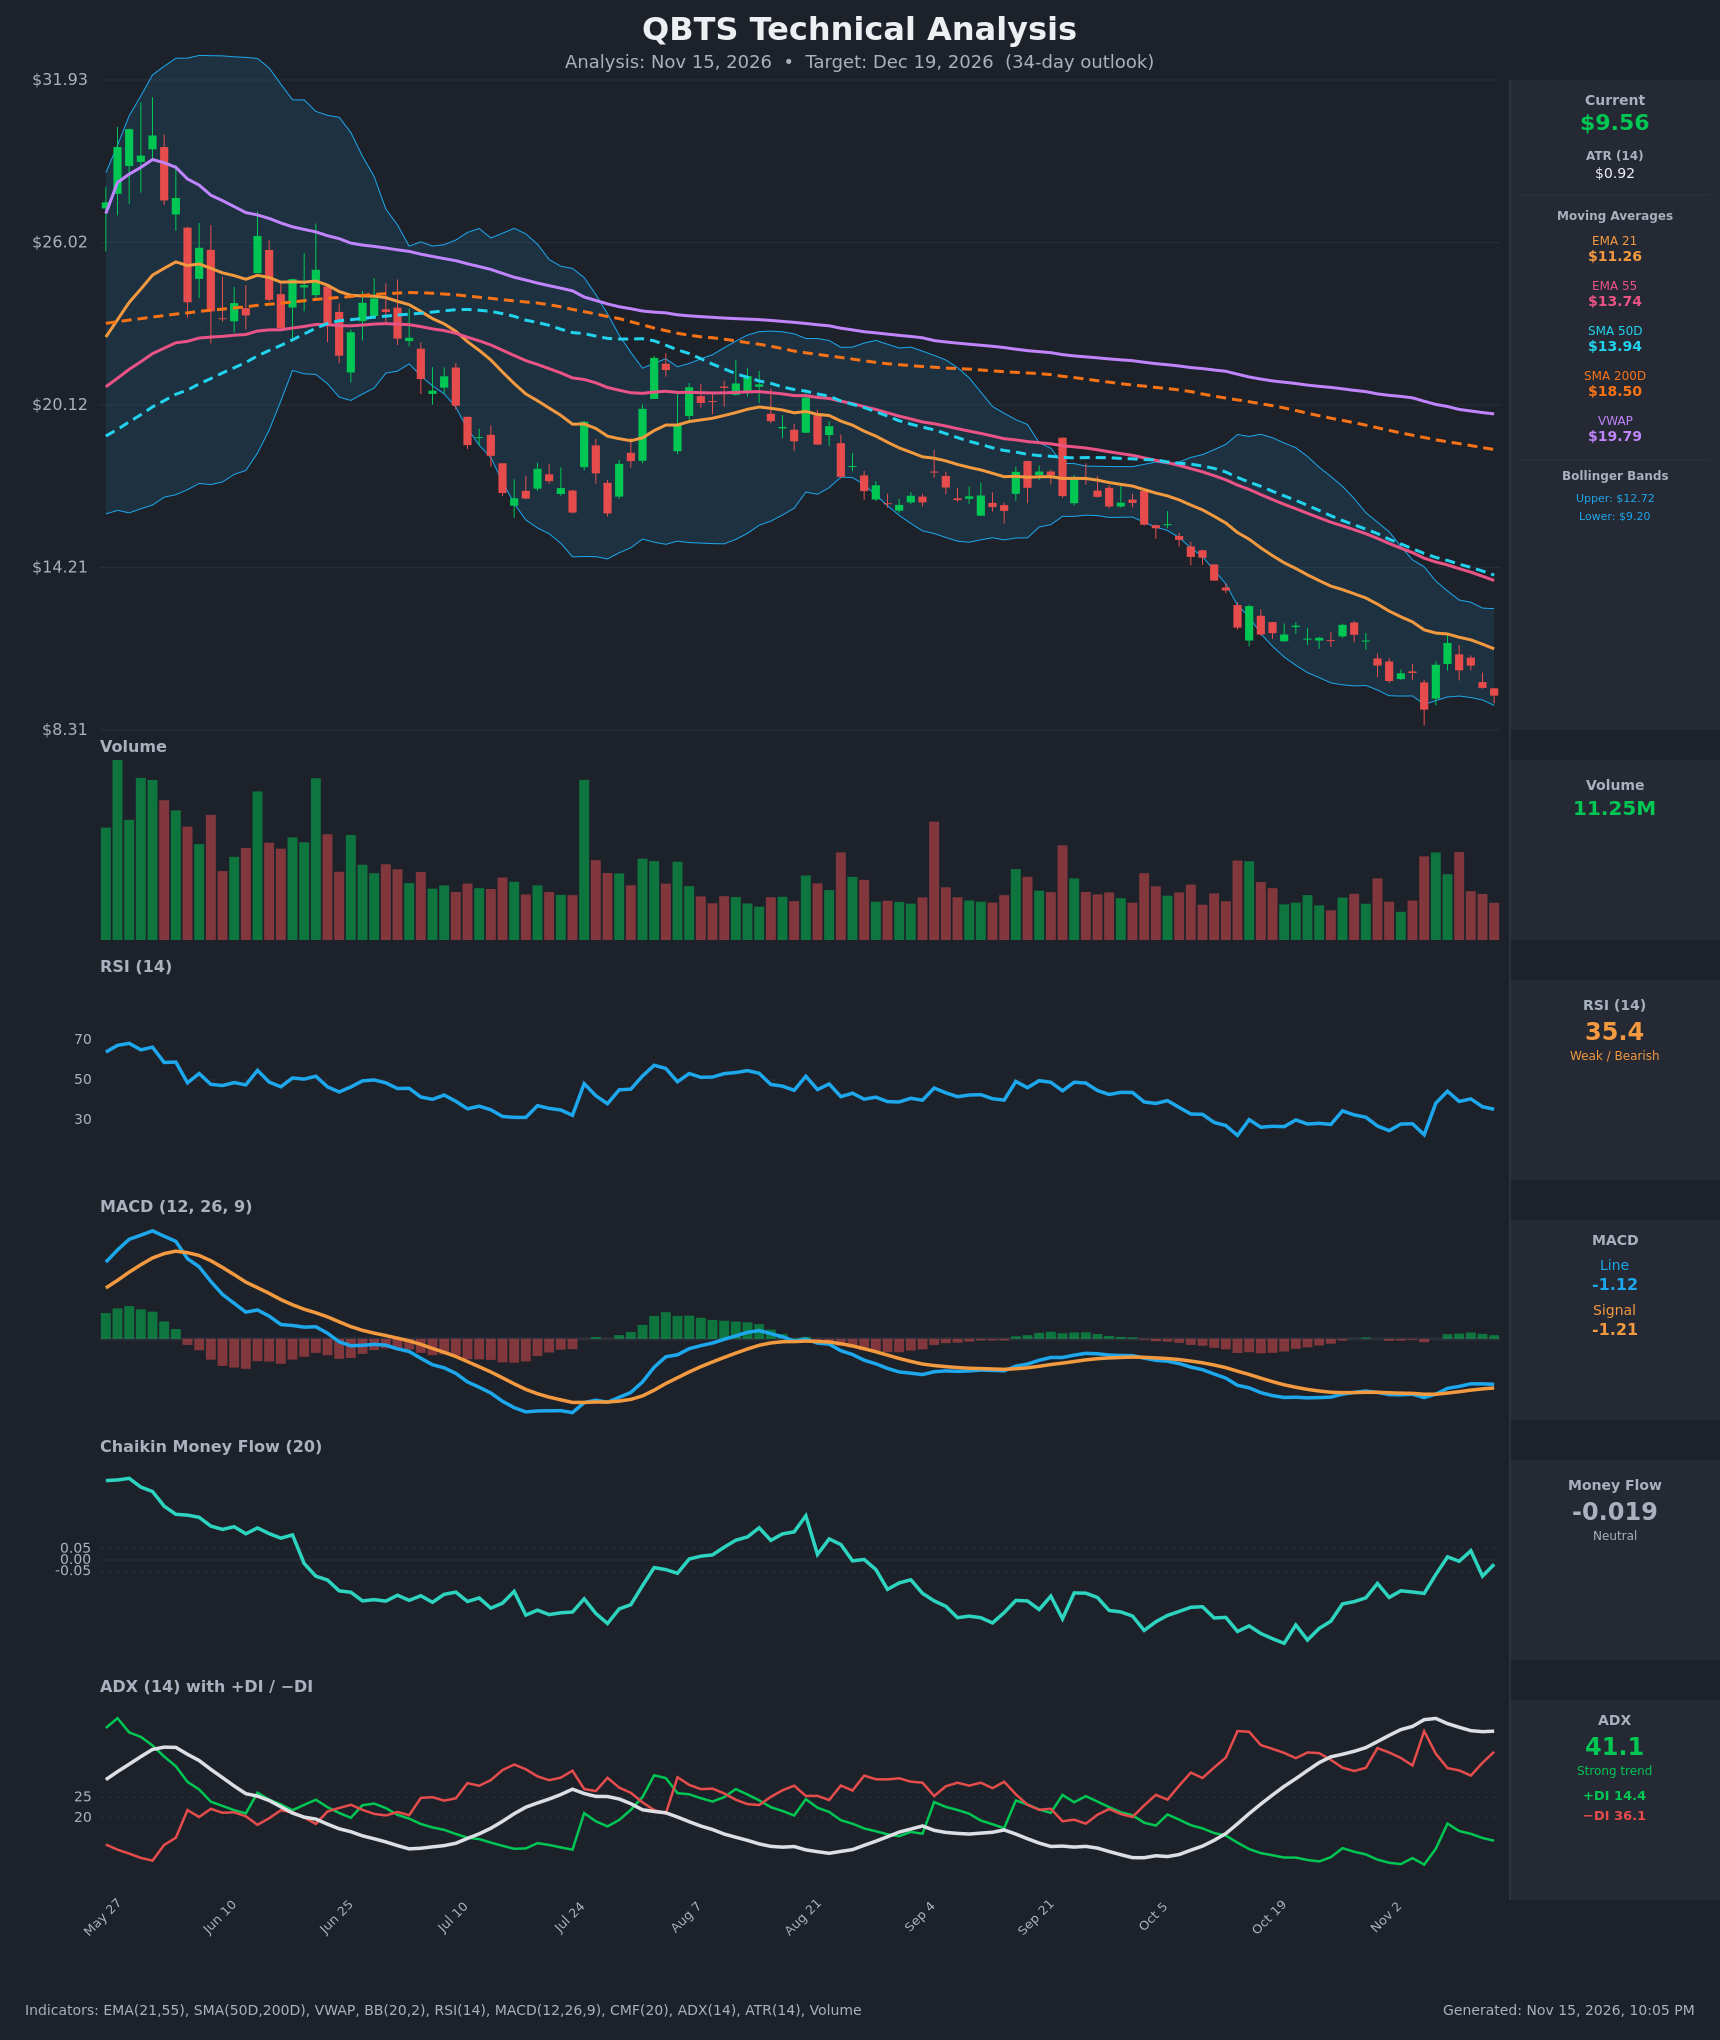
Analysis
TECHNICAL INDICATORS
- RSI (14): 35.35. It sits near oversold but has not reached the <30 zone. RSI bounced from 22.6 on Nov 5 to 44.4 on Nov 9, then rolled over to 35.4 as price made lower highs. Momentum is weak and fading after a failed relief rally. [Bearish]
- 20 EMA: The chart uses EMA 21 at $11.26. Price at $9.56 is about 15% below it, and the EMA is sloping down steadily (from $13.54 to $11.26 in 15 bars). The EMA 55 ($13.74) is far above and has been falling as well. The EMAs are stacked bearishly (price < EMA21 < EMA55) and act as overhead resistance. [Bearish]
- MACD: Line -1.12 versus signal -1.21, so the line is slightly above the signal and the histogram is marginally positive (~+0.09). The line crossed up on Nov 6-9, but both lines remain deep below zero and the line is flat to slightly lower since Nov 11. This is a weak, low-conviction bullish cross inside a strong downtrend, more of a momentum pause than a reversal. [Neutral]
- Bollinger Bands (20): Upper $12.72, lower $9.20, with price at $9.56 near the lower band. The bands are wide, which fits an elevated-volatility downtrend. Price has been walking along the lower band, which is typical of a strong trend rather than an automatic buy signal. A bounce to the mid-band (~$11) is possible, but the trend bias is lower. [Bearish]
- CMF (20): -0.019, in the neutral zone (between -0.05 and +0.05). It has improved from -0.27 in late October and briefly turned positive (+0.04 on Nov 11), so selling pressure has eased. Without sustained accumulation, this shows no confirmed buying support. [Neutral]
- ADX (14): 41.1 with -DI (36.1) far above +DI (14.4). This is a strong, established downtrend with bears firmly in control. ADX has been rising since early October and is still elevated. A reading above 40 can mean a mature trend, but there is no DI crossover. [Strong Trend – Bearish]
- Volume: 11.25M. Volume has been steady and mostly muted during the grind lower, with no capitulation spike. Selling has been orderly rather than climactic, so a washout low is not clearly in place. [Neutral to Bearish]
DIVERGENCES & TRENDS
- Moving averages: Price ($9.56) is below EMA21 ($11.26), EMA55 ($13.74), SMA50D ($13.94), SMA200D ($18.50), and VWAP ($19.79). The EMA21 has been below the EMA55 for the whole visible window, and the SMA50D is below the SMA200D (a death cross that is already in place and widening). This is a fully bearish structure.
- Price vs. RSI: Price made a new low at $9.05 on Nov 5 with RSI at 22.6. Price is now at $9.56 with RSI at 35.4, so RSI is higher than at the prior low. The price lows ($9.05 and ~$9.56) are similar while RSI shows a modest higher low, which is an early, mild bullish divergence. It is unconfirmed and weak, and so far it has produced only a bounce that failed at ~$11.5-12.
- MACD: The line is rising slightly off its lows and is just above the signal, but it remains deeply negative. This is a stall in downside momentum, not a trend change.
- CMF: It recovered from -0.27 to about 0, a mild improvement in money flow. It has not confirmed accumulation.
- Trend: ADX is rising with -DI dominant, and the series of lower highs (~$12.1 on Oct 27, ~$11.5 on Nov 9) and lower lows persists. The Nov 9 rally stalled at the EMA21 (~$11.8), which confirms dynamic resistance.
CHART PATTERNS
- Primary pattern: A persistent descending channel/trend of lower highs and lower lows since the ~$30 peak. The recent price action in the $9-$12 area resembles a Bearish Flag/Pennant continuation (small consolidation after a sharp leg down), with the bounce to $11.5 failing below the EMA21.
- Possible counter-pattern: The two lows at ~$9.05-$9.56 hint at a Bullish Double Bottom with a neckline near $11.5-$12. It would need a close above ~$11.8 (the EMA21 and the recent high) to activate, and a measured move would target ~$14. This has lower probability given the trend strength and the bearish MA stack.
- Targets: If the flag breaks lower (close below ~$9.05), the measured move is roughly the flag height (~$2.5-3) projected down, giving about $6.50-$7.00. The bullish double-bottom alternative targets ~$13-14, but that requires reclaiming the EMA21.
POTENTIAL SCENARIOS
- Scenario 1: Bearish Trend Continuation — The strong downtrend (ADX 41, -DI 36 vs +DI 14) and the bearish MA stack keep price pressed down. A break of the $9.05-$9.20 support zone (Nov 5 low and lower Bollinger Band) extends the decline. Trigger: Daily close below $9.05 on rising volume. Target: $7.60-$8.00 initially, with an extension to ~$7.00. Invalidation: Daily close above $11.30 (EMA21). (55% probability)
- Scenario 2: Neutral/Choppy Basing Range — Price holds the $8.80-$9.20 support area and chops between ~$9 and ~$11 as RSI and CMF stabilize and the mild RSI divergence plays out. Trigger: Repeated defense of $9.05 with CMF holding around zero. Target: $9.00-$11.00 range. Invalidation: Close below $8.80 or above $11.80. (20% probability)
- Scenario 3: Bullish Relief Rally / Double Bottom — An oversold bounce driven by the RSI higher low and the MACD cross, with CMF turning positive. Trigger: Close above $10.70-$11.00, then above the EMA21 (~$11.26). Target: $12.50-$13.00 (mid-to-upper Bollinger Band and near the EMA55/SMA50D). Invalidation: Close back below $9.05. (25% probability)
PRICE TARGETS
For the 34-day horizon (to Dec 19, 2026), I weight the bearish continuation most heavily. The trend indicators agree: ADX 41, -DI dominance, a death cross in place, and price below every moving average. The Bollinger and RSI readings argue for bounces but not for a reversal. The target is modestly below the current price because of the oversold bounce risk and the possibility of a basing range.
Range check: the width is $12.00 - $6.60 = $5.40, which is 56.5% of the $9.56 price. That is too wide for a 30-60 day horizon (12-18%), but the guidance is a baseline, and with ATR of $0.92 (~9.7% daily) this stock is far more volatile than a typical stock. I am therefore tightening it to the high end of what the volatility supports: $7.20 to $11.00 is $3.80 wide (~39.7% of price). I accept this as a deliberate widening over the formula because of QBTS's extreme volatility (a typical 34-day move of ±1 ATR × √24 trading days is about ±$4.5).
- Target Price: $8.10 (34-day target, below the current price in line with the bearish bias)
- Expected Range: $7.00 to $11.00
- Key Levels: Support at $9.05, Resistance at $11.26
OVERALL BIAS
OVERALL BIAS: BEARISH - A strong, established downtrend (ADX 41.1, -DI 36.1 vs +DI 14.4) with price below all key moving averages, a death cross in place, and lower highs at EMA21 resistance. The mild RSI divergence and neutral CMF argue for bounces, but a break of $9.05 support is the more likely path over the next 34 days.
This is educational analysis and not financial advice.