QBTS 27-day bearish forecast — Nov 15, 2026
- Bias: Bearish
- Timeframe: 27 days (made Nov 15, 2026, target date Dec 11, 2026)
- Price at analysis: $9.56
- Price target: $8.70
- Expected range: $7.60 – $10.90
- Result: Pending — graded after the close on Dec 11, 2026
Get a free AI analysis of QBTS today
Analysis
TECHNICAL INDICATORS
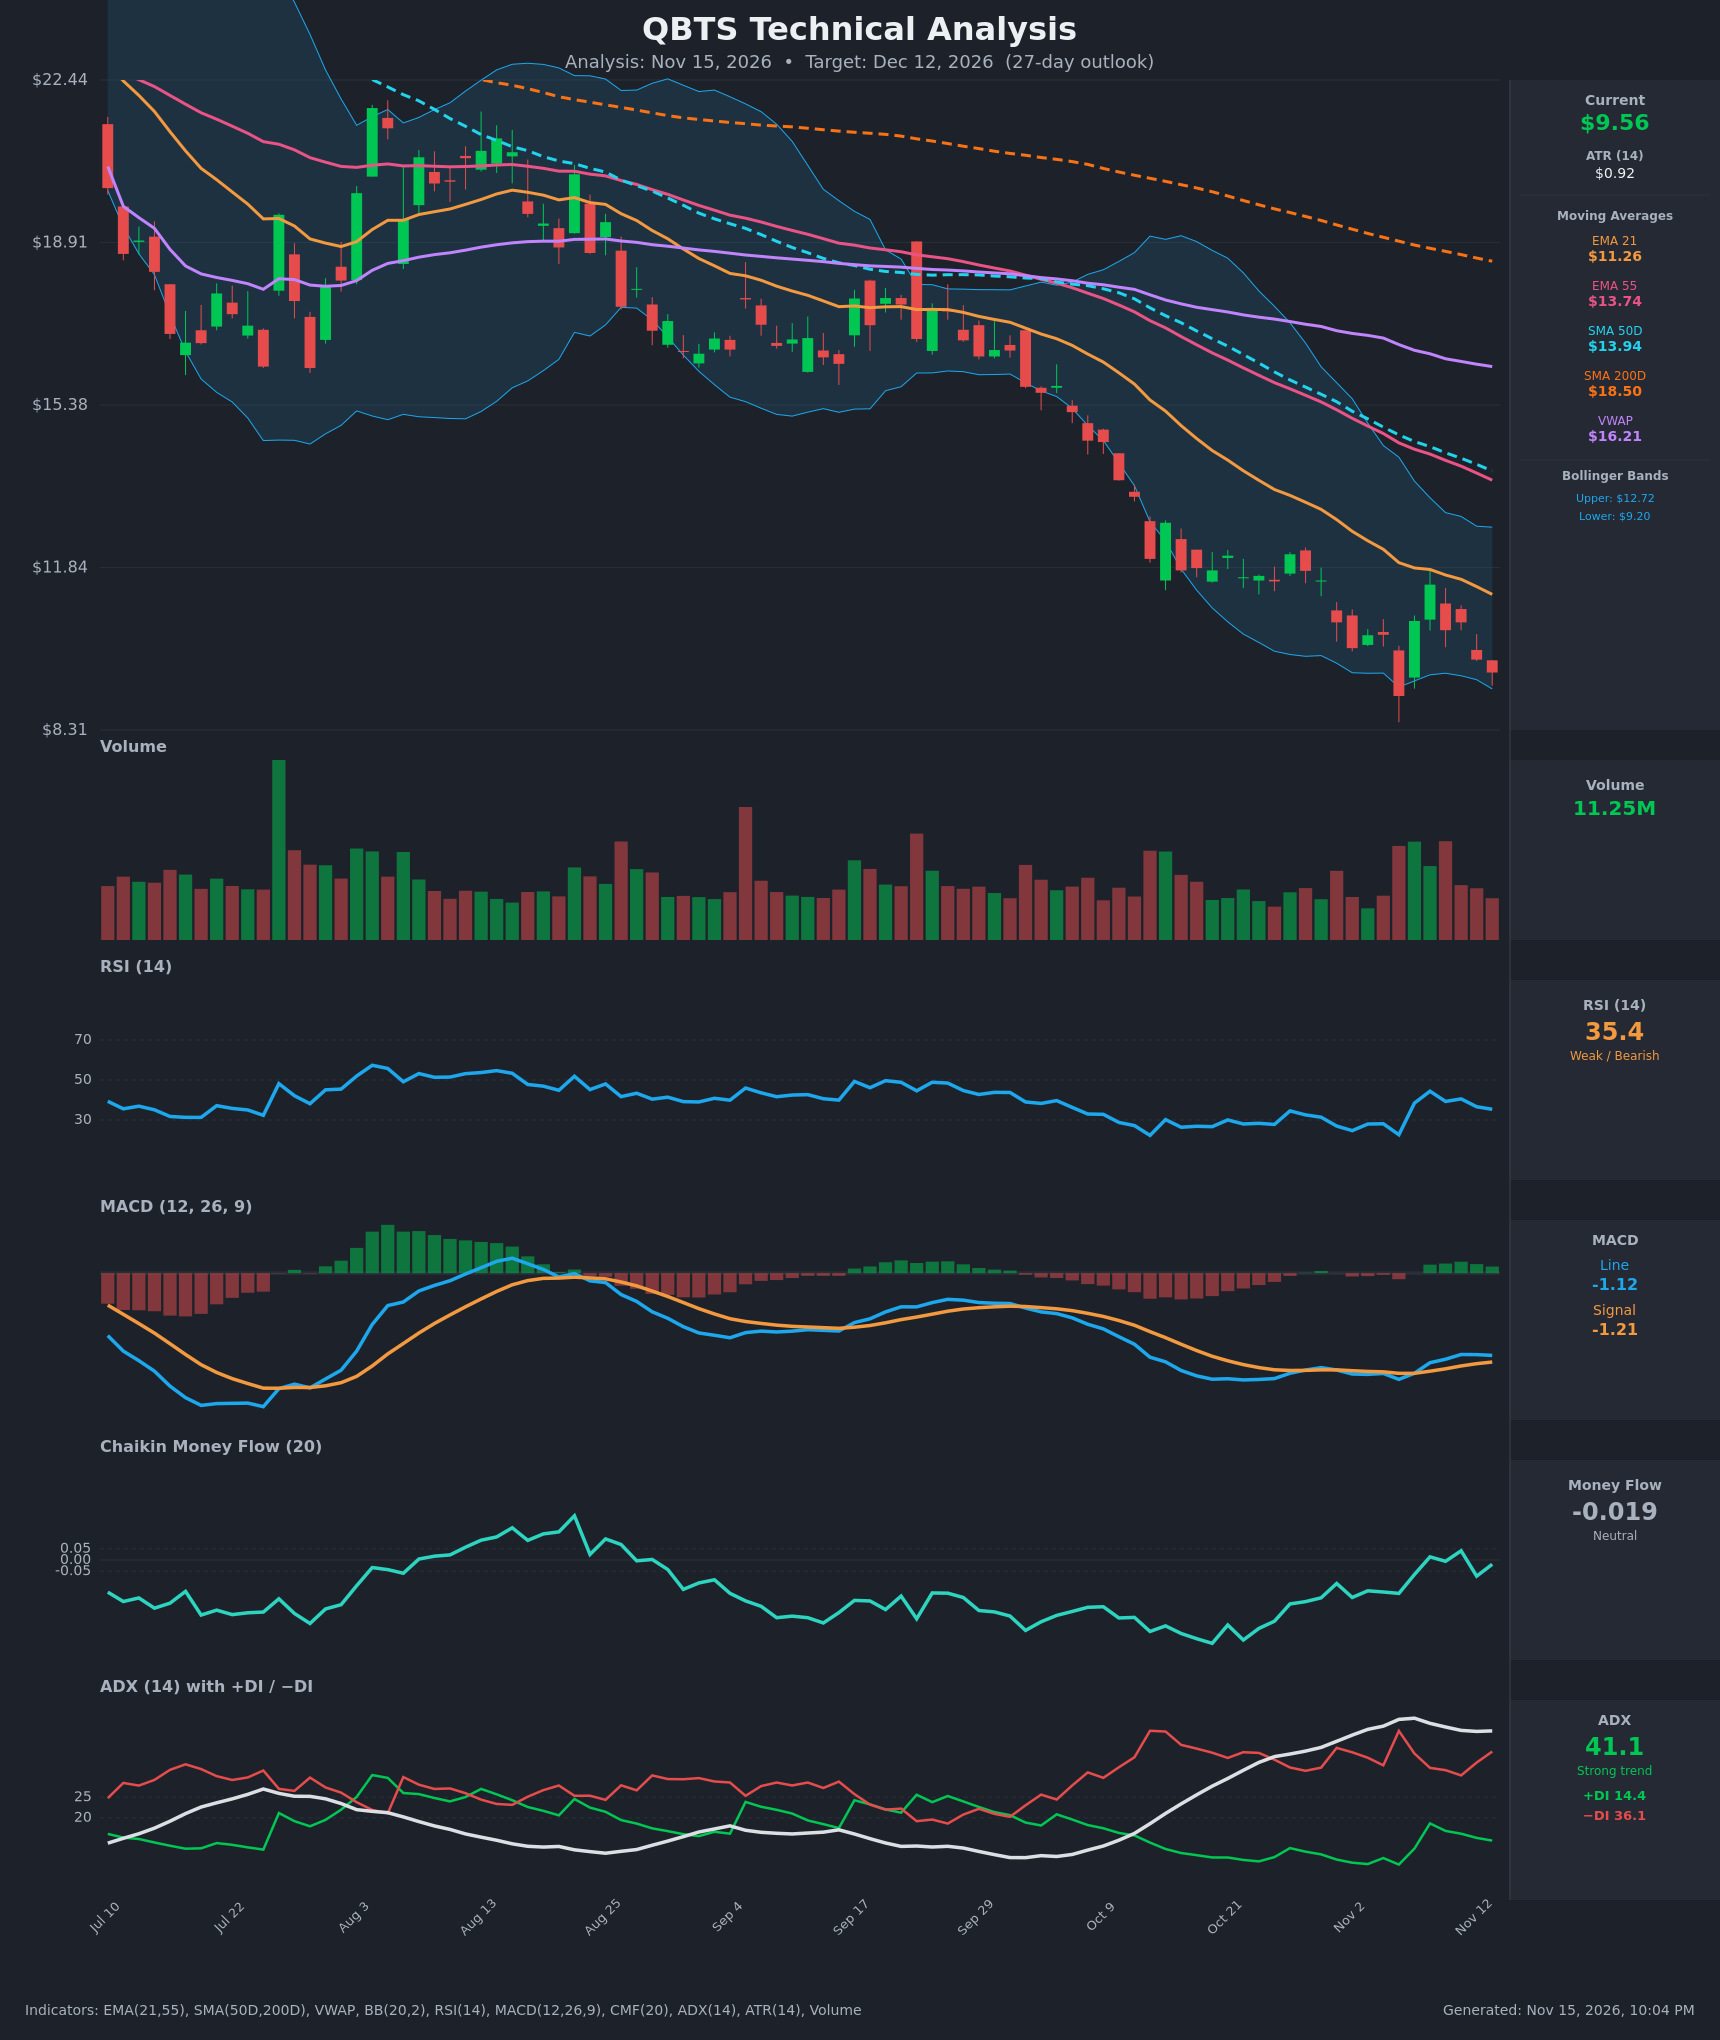
- RSI (14): 35.35, below 50 and near the oversold zone. It bounced from 22.6 on Nov 5 to 44.4 on Nov 9, then rolled over to 35.4. The failed rebound with lower RSI highs shows momentum still favors sellers. [Bearish]
- 20 EMA: The 21 EMA is $11.26 and price is $9.56, about 15% below it. It is sloping down and has acted as resistance on every bounce. The 21 EMA is also well below the 55 EMA ($13.74), an established bearish EMA stack. [Bearish]
- MACD: Line -1.12 is above signal -1.21, giving a small positive histogram. This is a mild bullish crossover that began Nov 6-9, but both lines are deeply negative and the line has flattened (-1.11 to -1.12) while the histogram narrows. It shows selling exhaustion, not a trend reversal. [Neutral]
- Bollinger Bands (20): Upper $12.72, lower $9.20, and price at $9.56 sits in the bottom ~10% of the band, near the lower band. The bands are wide, so volatility is elevated. Price has been walking the lower band, which is typical of a downtrend. A bounce toward the $11.26 midline is possible, but there is no squeeze or reversal signal. [Bearish]
- CMF (20): -0.019 is neutral, between ±0.05. It has improved from -0.27 in late October and briefly turned positive on Nov 9 and Nov 11, but it slipped back negative. Selling pressure is easing, but there is no accumulation. [Neutral]
- ADX (14): 41.1 is a strong trend and has been rising. −DI (36.1) is far above +DI (14.4), so bears are firmly in control. The recent +DI bounce to 18.6 failed, and −DI is rising again. [Strong Trend – Bearish]
- Volume: 11.25M, in line with or below recent averages, with no capitulation spike. The Nov 5 flush to $9.05 had a sharp reversal, but there was no follow-through buying on a bounce. Declining volume on this bounce suggests weak conviction from buyers. [Neutral to Bearish]
DIVERGENCES & TRENDS
- Mild bullish divergence: Price made a lower low at $9.05 on Nov 5 and sits at $9.56, while the MACD histogram has turned positive and CMF has improved from -0.27 to near zero. This signals slowing downside momentum, not a confirmed reversal.
- RSI: Lower highs (44.4 to 40.5 to 35.4) after the bounce show weak recovery momentum.
- Moving averages: The death cross is already in place, with SMA50D ($13.94) well below SMA200D ($18.50). Price is below all MAs and VWAP ($16.21). The EMA21 is below the EMA55, which is below the SMA50D.
- Trend: The chart shows a persistent lower-high, lower-low sequence from the ~$22 area in July to $9.56.
- Support test: Price is pressing the lower Bollinger Band at $9.20 and the Nov 5 low at $9.05, which is the key support zone.
CHART PATTERNS
- Bearish Pennant / Flag (continuation): After the sharp decline in October, price has consolidated in the $9.05 to $12.2 range with lower highs, resembling a bearish flag/pennant. A breakdown below $9.05 targets roughly a measured move toward $7.0 to $7.5.
- Possible Bullish Double Bottom: The Nov 5 low ($9.05) and the current area (~$9.5) could form a double bottom. It is unconfirmed, requires a close above the ~$11.5 neckline to validate, and carries a bullish target of about $13 to $14.
- With ADX at 41 and −DI dominant, the continuation pattern has the higher probability.
POTENTIAL SCENARIOS
- Scenario 1: Bearish Breakdown Continuation — Price loses the $9.05 low and the lower Bollinger Band, and the downtrend resumes with −DI dominant and every MA acting as resistance. Trigger: daily close below $9.05. Target: $7.60 to $8.20. Invalidation: close above $11.30 (21 EMA). (50% probability)
- Scenario 2: Neutral Range-Bound Basing — Price holds $9.05 to $9.20 support and chops between $9.0 and $11.3 as selling exhaustion plays out, with the MACD turn and CMF improvement keeping the downside contained. Trigger: repeated holds of $9.05 with declining volume. Target: $9.5 to $10.8. Invalidation: close below $9.00 or above $11.50. (28% probability)
- Scenario 3: Bullish Relief Rally / Double Bottom — A reflex bounce from oversold levels, driven by the MACD crossover and improving CMF, moves price toward the 21 EMA and the Bollinger midline. Trigger: close above $10.70 and then $11.30 on rising volume. Target: $11.30 to $12.70. Invalidation: close below $9.05. (22% probability)
PRICE TARGETS
Timeframe: 27 days, which falls in the 14-60 day band, so the range width is ~12-15% of current price. The range is $8.00 to $10.90 ($2.90 width, ~30%). That is wider than the 30-60 day guidance because QBTS is a high-volatility stock (ATR $0.92, or ~9.7% of price). Range width is ~30% of the current price of $9.56, which is justified by the elevated ATR.
- Target Price: $8.70 (27-day, below current price, consistent with the bearish bias)
- Expected Range: $7.60 to $10.90
- Key Levels: Support at $9.05, Resistance at $11.26
OVERALL BIAS
OVERALL BIAS: BEARISH - ADX at 41 with −DI (36.1) far above +DI (14.4), a death cross, and price below all moving averages and VWAP point to continued downside, while the MACD crossover and CMF recovery only signal slowing momentum. A break below $9.05 would open a move toward the $7.60 to $8.20 area.
This is educational analysis and not financial advice.