QBTS 83-day bearish forecast — Nov 15, 2026
- Bias: Bearish
- Timeframe: 83 days (made Nov 15, 2026, target date Feb 5, 2027)
- Price at analysis: $9.56
- Price target: $8.60
- Expected range: $6.60 – $11.90
- Result: Pending — graded after the close on Feb 5, 2027
Get a free AI analysis of QBTS today
Analysis
TECHNICAL INDICATORS
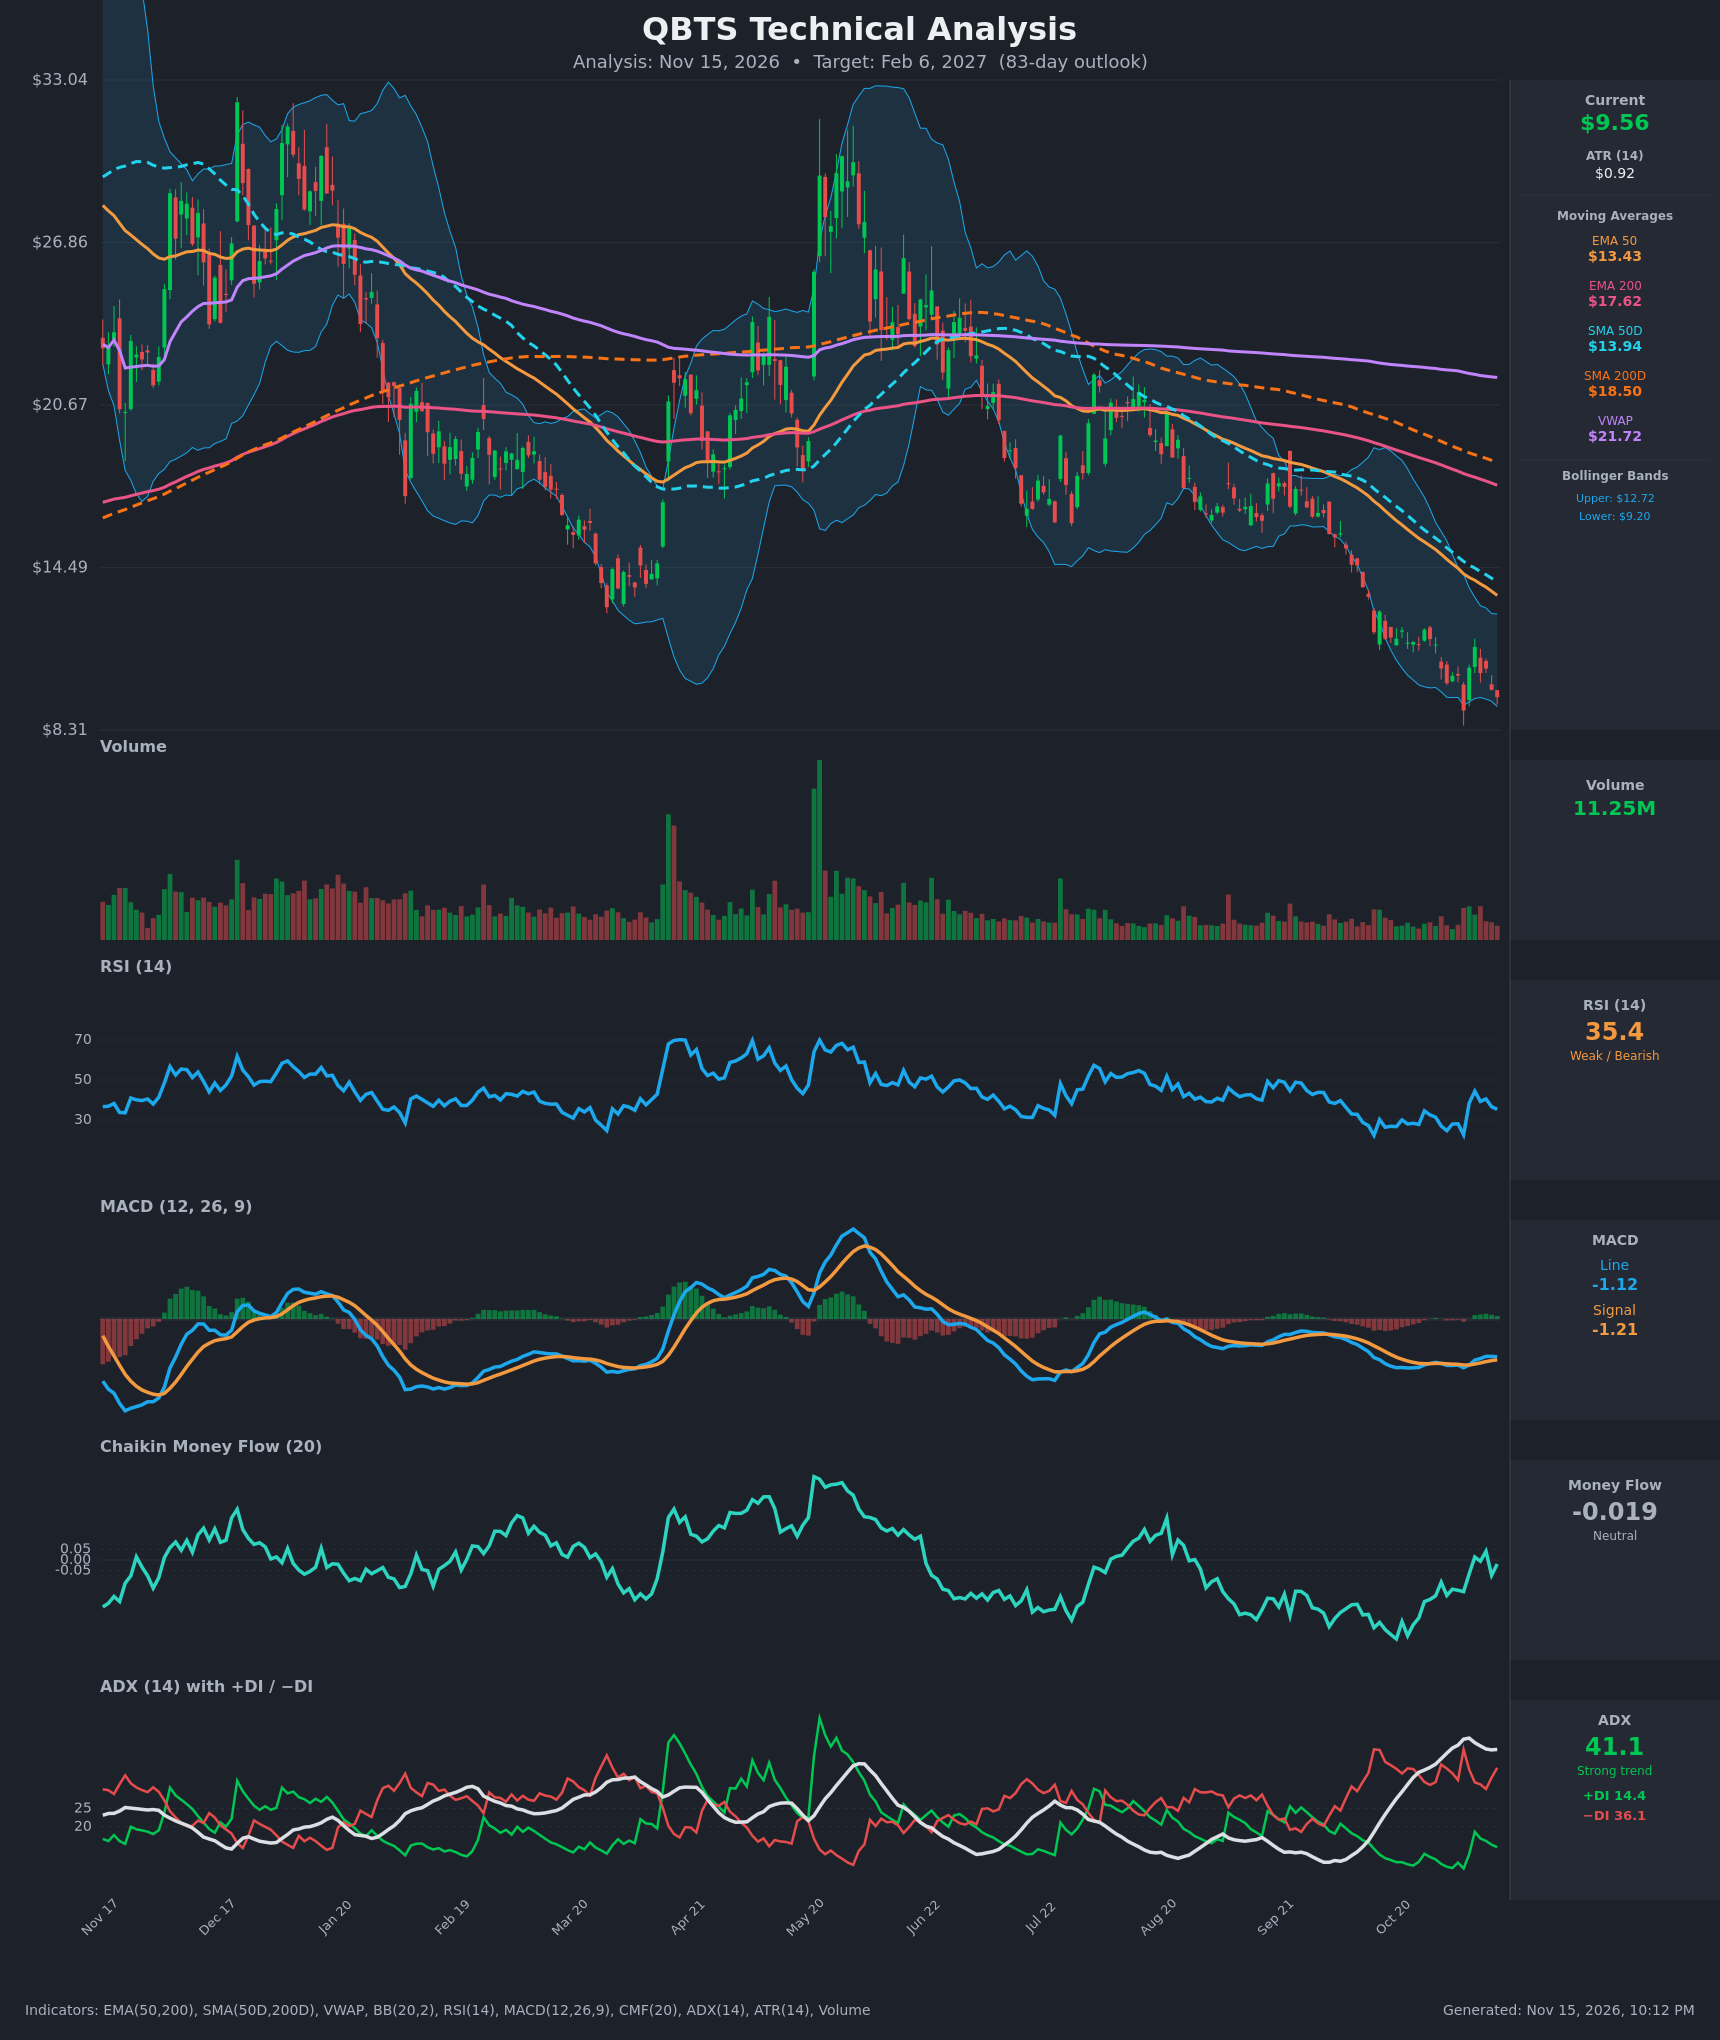
- RSI (14): 35.35, down from a 44.4 bounce on Nov 9 and just above oversold. It hit 22.6 on Nov 5, so momentum is weak but not washed out. Rallies keep failing around 40-44. [Bearish]
- 20 EMA: The 20 EMA isn't provided. The EMA 50 is $13.43 and falling, about 29% above price, and the 20-period average would sit well above $9.56. Price is below every moving average, so they act as overhead resistance. [Bearish]
- MACD: The line is -1.12 and the signal is -1.21, so the line is slightly above the signal. A bullish crossover occurred around Nov 6-9. Both lines are deeply negative, and the line has flattened since Nov 12 at -1.11 to -1.12. The histogram is barely positive (~+0.09), which signals fading downside momentum rather than a real reversal. [Neutral]
- Bollinger Bands (20): Price at $9.56 is near the lower band ($9.20) and well below the upper band ($12.72). The bands are still wide. Price has been hugging the lower band since late October, which is a sign of a persistent downtrend. A close at $9.05 on Nov 5 undercut the band before a sharp bounce. [Bearish]
- CMF (20): -0.019, in the neutral zone (±0.05). It improved from -0.273 on Oct 26 and briefly turned positive (+0.041 on Nov 11). Selling pressure has eased, but there is no real accumulation. [Neutral]
- ADX (14): 41.1 and rising from 34.9, so the trend is strong. −DI at 36.1 is far above +DI at 14.4, which means bears are firmly in control. [Strong Trend – Bearish]
- Volume: 11.25M, light compared with the spikes in the spring. Volume has been fading during the decline, so the sell-off is orderly rather than capitulative, with no climactic washout yet. [Neutral to Mildly Bearish]
DIVERGENCES & TRENDS
- Bullish MACD/RSI divergence (minor): Price made a lower low at $9.05 on Nov 5 with RSI at 22.6, and the current $9.56 reading comes with RSI at 35.4 and MACD above its Oct lows. This hints at slowing downside momentum, but it is not yet confirmed by price.
- Moving average structure: The EMA 50 ($13.43) is well below the EMA 200 ($17.62), and the SMA 50D ($13.94) is below the SMA 200D ($18.50). The death cross is in place and the gaps are still widening.
- Price vs. VWAP: Price is at $9.56 against VWAP of $21.72, a 56% discount. That reflects a heavy overhead supply zone, not an actionable buy signal.
- DI trend: −DI has stayed above +DI throughout the table. The brief +DI rise to 18.6 on Nov 9 faded quickly, and ADX has not rolled over.
- Lower highs and lower lows: The chart shows a clear sequence from the ~$33 area to the $9 area, and the late-Oct/Nov bounces (about $12.13 and $11.47) have been sold.
CHART PATTERNS
- Primary pattern: Bearish Rising Wedge / Bearish Flag (continuation) in the broader decline. The multi-month structure is a persistent downtrend with lower highs, and the recent bounces have been shallow and corrective.
- Possible Bullish Falling Wedge (reversal) in the short term. Since late October the closes have been grinding lower inside converging, down-sloping bands. A confirmed break above ~$11.50-$12.00 would activate it, but there is no confirmation yet.
- Double-bottom attempt: The $9.05 (Nov 5) and $9.56 (Nov 13) lows are similar. A double bottom would need a break above the ~$11.47 neckline, so it is not confirmed.
- Significance: The trend-continuation evidence (ADX 41, −DI dominance, death cross, price below all MAs) outweighs the tentative reversal signals. A measured move lower from the recent breakdown would suggest the $7-$8 zone.
POTENTIAL SCENARIOS
- Scenario 1: Bearish Trend Continuation — The strong downtrend (ADX 41, −DI 36) resumes, with price breaking the Nov 5 low at $9.05 and grinding lower as rallies fail below the falling EMA 50. Trigger: daily close below $9.05. Target: $7.25-$8.00. Invalidation: daily close above $11.50. (50% probability)
- Scenario 2: Neutral Base Building / Range — Price consolidates between roughly $8.50 and $11.50 as RSI and MACD stabilize, forming a double-bottom-type base. Trigger: holds $9.00 with several closes in the $9-$11 band. Target: $9.50-$10.50. Invalidation: close below $8.50 or above $12.00. (22% probability)
- Scenario 3: Bullish Oversold Reversal — A short-covering rally develops from the double-bottom area, aided by the MACD bullish cross and fading volume on declines. It breaks the $11.50 neckline and heads toward the EMA 50. Trigger: close above $11.50 on rising volume. Target: $13.40-$14.00. Invalidation: close back below $9.05. (28% probability)
PRICE TARGETS
For the 83-day timeframe (to Feb 6, 2027), the range width should be about 18-30% of the current price. QBTS is volatile (ATR $0.92, about 9.7% of price), so I use a range near the upper end of that band.
- Target Price: $8.60 (about 10% below current)
- Expected Range: $6.60 to $11.90 (width $5.30, about 55% of the current price; this exceeds the formula guidance but is justified by ATR of about 9.7% of price and a historically very volatile name)
- Key Levels: Support at $9.05 (Nov 5 low), Resistance at $11.47 (Nov 9 high / neckline)
Self-check: the range is much wider than any 2-14 day range. The wider width reflects this ticker's high volatility.
OVERALL BIAS
OVERALL BIAS: BEARISH - ADX at 41 with −DI (36.1) far above +DI (14.4), a death cross in place, price below every moving average, and repeated failed bounces point to continued downside. Slowing momentum (MACD cross, neutral CMF) argues for a possible base, so the conviction is moderate.
This is educational analysis and not financial advice.