QBTS 20-day bearish forecast — Nov 15, 2026
- Bias: Bearish
- Timeframe: 20 days (made Nov 15, 2026, target date Dec 4, 2026)
- Price at analysis: $9.56
- Price target: $8.85
- Expected range: $7.90 – $10.95
- Result: Pending — graded after the close on Dec 4, 2026
Get a free AI analysis of QBTS today
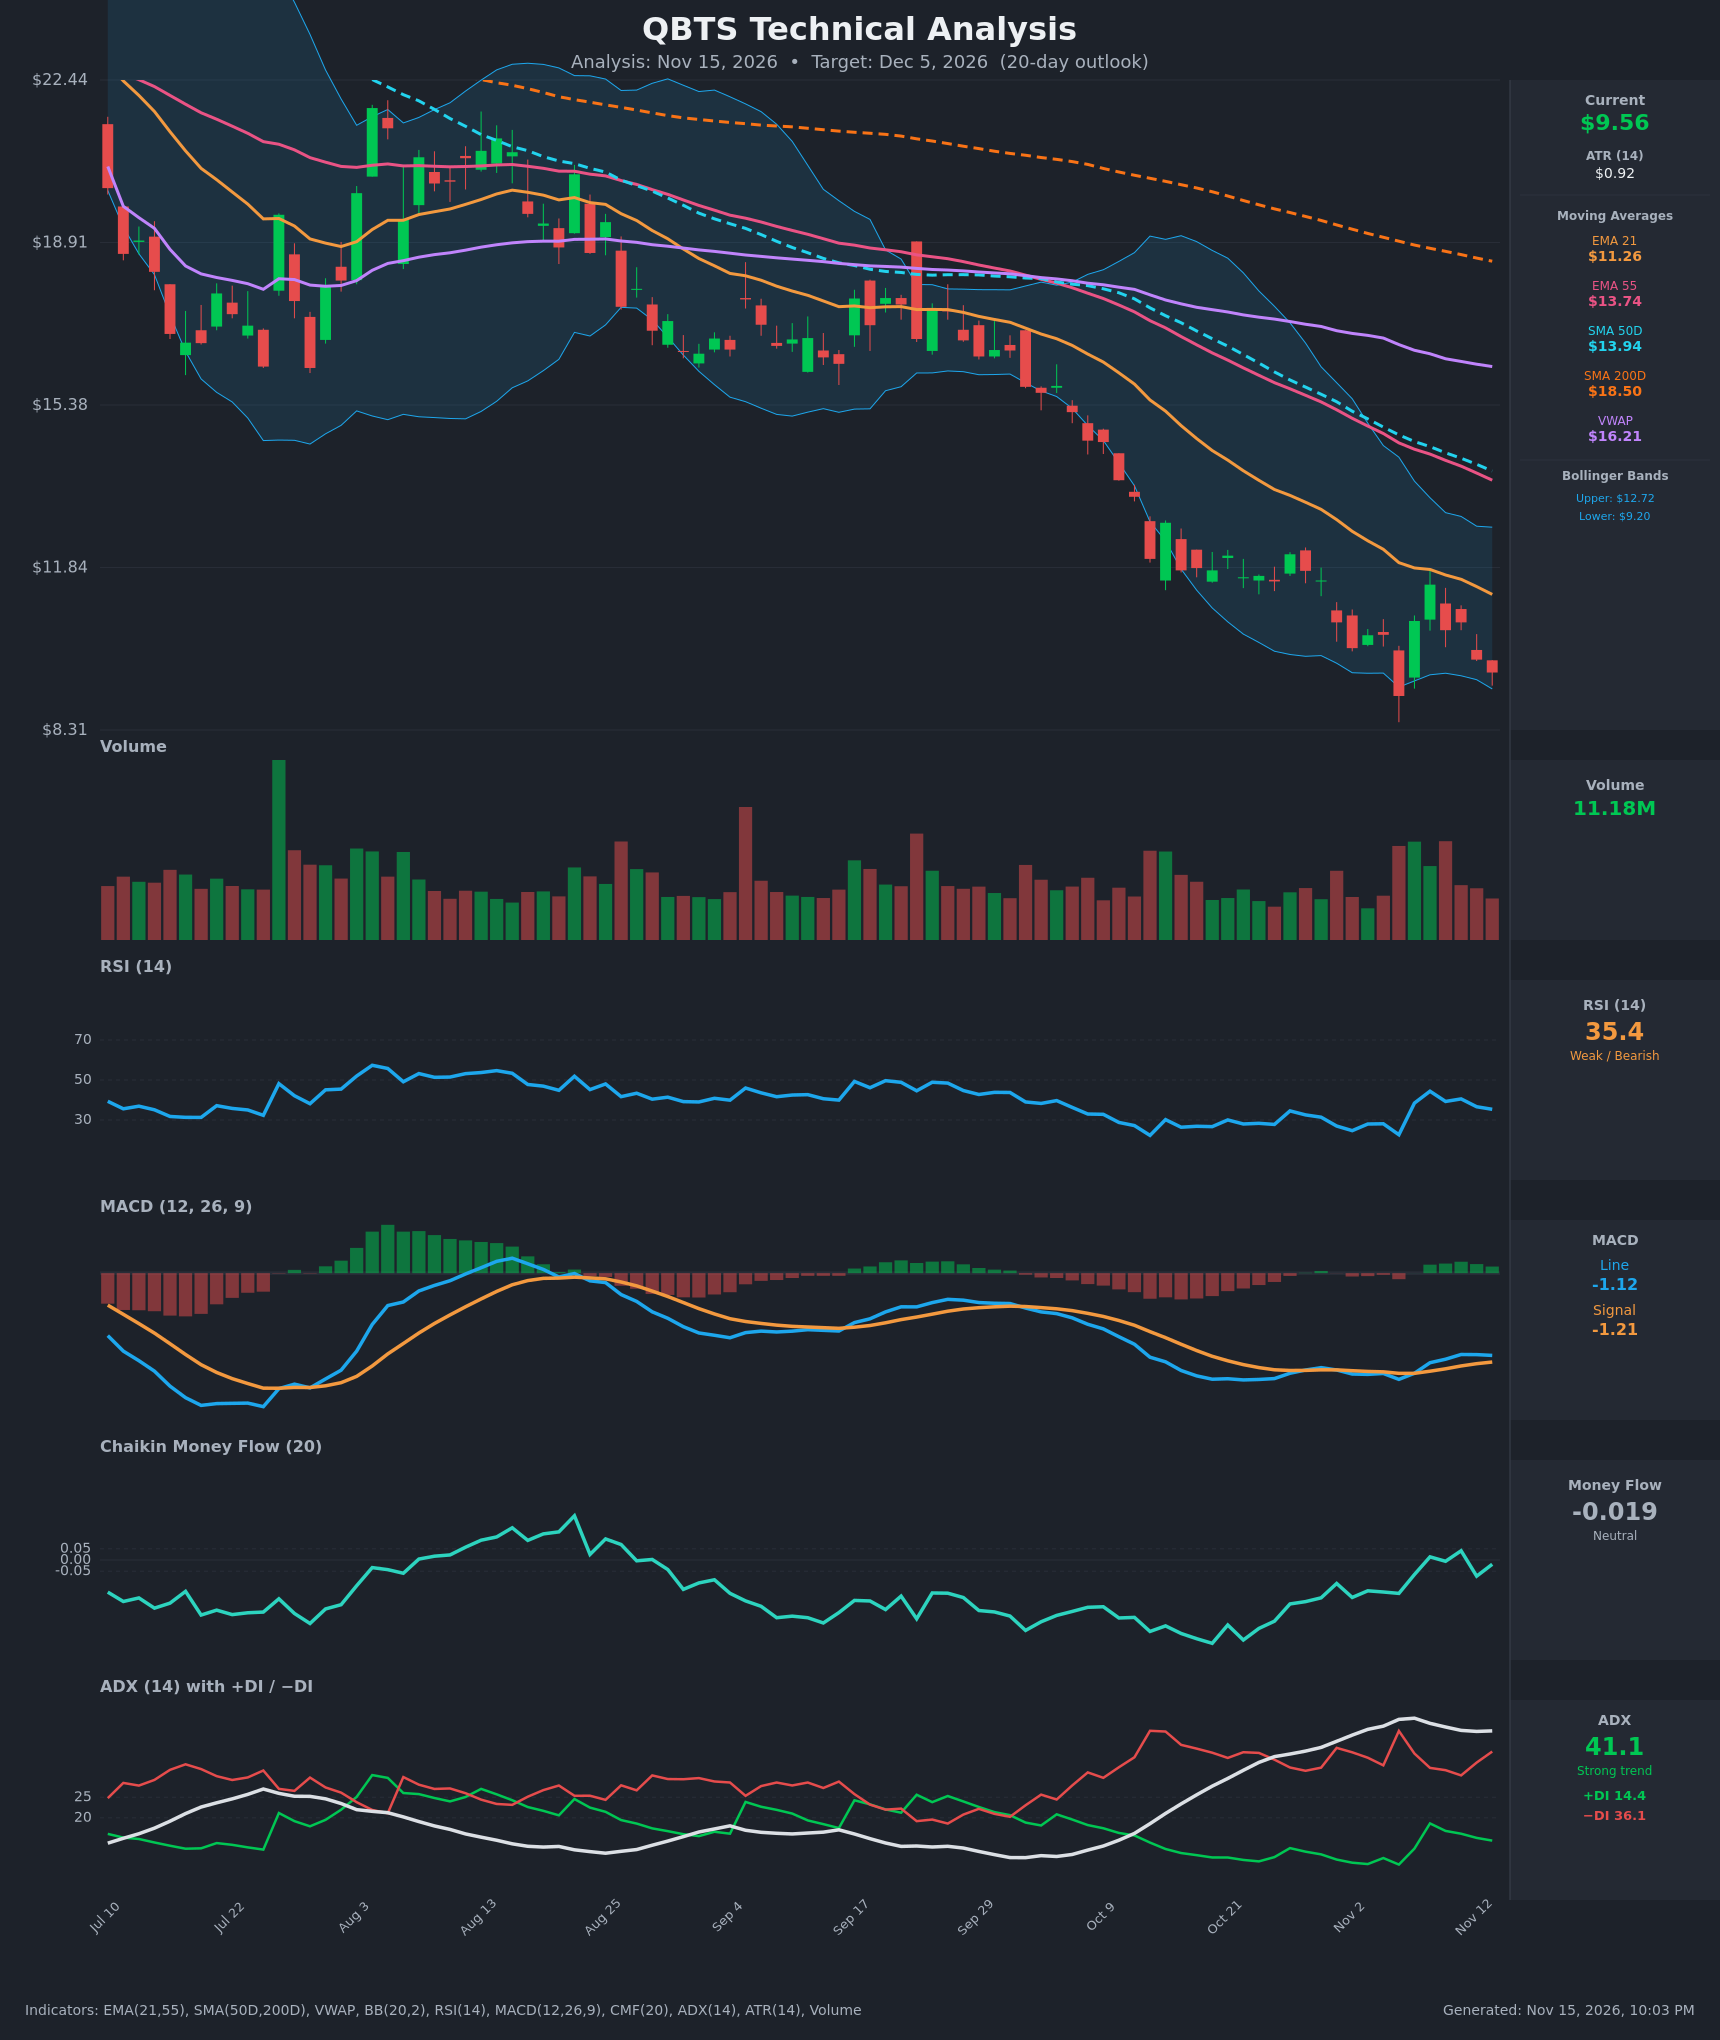
Analysis
TECHNICAL INDICATORS
- RSI (14): 35.35, below the 50 midline and close to oversold. It has rolled over from 44.4 on Nov 9 and is making lower highs. It bounced from 22.6 on Nov 5 but has failed to regain 45. [Bearish]
- 20 EMA (EMA 21 = $11.26): Price at $9.56 is about 15% below the EMA 21. The EMA 21 is below the EMA 55 ($13.74) and both are falling, so the EMA 21 is overhead resistance. [Bearish]
- MACD: Line -1.122 is just above the signal at -1.213, so the histogram is slightly positive. The line crossed up on Nov 6 and the momentum improvement has stalled, with the line flattening at -1.11 to -1.12. The reading is deeply negative and the bullish cross is weak. [Neutral]
- Bollinger Bands (20): Price is $9.56 against a lower band of $9.20 and an upper band of $12.72, so it sits in the lower quarter of the bands. The bands are wide and sloping down, and price has repeatedly ridden the lower band. This shows a trending move rather than a squeeze. A Nov 5 wick to about $9.05 pierced the lower band and was bought. [Bearish]
- CMF (20): -0.019 is in the neutral band (±0.05). It has improved from -0.27 on Oct 26 and briefly turned positive on Nov 9 and Nov 11. Selling pressure is easing, but there is no accumulation yet. [Neutral]
- ADX (14): 41.1, a strong trend, and flat to slightly up after peaking at 44.2. −DI at 36.1 is far above +DI at 14.4, so bears are in control. The ADX is high and the trend is mature, which raises the risk of a relief bounce. [Strong Trend – Bearish]
- Volume: 11.18M, about average for recent sessions. Selling days carry heavier volume, but there are no capitulation spikes. The Nov 5 flush and Nov 6 rebound had decent volume without follow-through. [Neutral to mildly Bearish]
DIVERGENCES & TRENDS
- Moving average structure: Price is below the EMA 21, EMA 55, SMA 50 ($13.94), VWAP ($16.21) and SMA 200 ($18.50). The SMA 50 is below the SMA 200, which is a death cross already in force. Every average is sloping down, so the long-term downtrend is intact.
- Mild bullish divergence: Price made a new low at $9.05 on Nov 5 with RSI at 22.6. The later push back to the $9.56 area has RSI at 35 and MACD at -1.12 against -1.45 at the Nov 5 low. Momentum is less negative than at the prior price low, which points to selling exhaustion. It has not been confirmed by price.
- CMF improvement: CMF has risen from -0.27 to about -0.02, showing less distribution. The MACD is above its signal line from a low base.
- Lower highs: The rebound high of $11.47 on Nov 9 failed below the EMA 21, and price has since slipped back to $9.56. This is lower-high behavior inside a downtrend.
- DI trend: +DI rallied to 18.6 on Nov 9 and has faded to 14.4 while −DI is turning back up (30.3 → 36.1). Sellers are regaining control.
CHART PATTERNS
- Bearish Flag/Pennant (continuation): After the sharp drop from about $15 to $11.80 in October, price consolidated in a narrow range around $10–12.50. It then broke lower toward $9. This resembles a bearish flag or pennant continuation. The measured move points to the $8–9 area.
- Possible Bullish Double Bottom (reversal, unconfirmed): Lows near $9.05 (Nov 5) and the current $9.56 could form a double bottom. It needs a close above the Nov 9 swing high of about $11.47 to confirm, and that is far from current price. The pattern remains speculative.
- Overall: The dominant structure is a persistent downtrend of lower highs and lower lows. The bearish continuation read has more weight than the reversal read.
POTENTIAL SCENARIOS
- Scenario 1: Bearish Trend Continuation — The downtrend continues with a break of the $9.05 swing low. ADX above 40 with −DI dominant favors continued selling, and the EMA 21 and the falling bands cap rallies. Trigger: close below $9.05 (the Nov 5 low and lower Bollinger Band area). Target: $8.00–$8.30 (about 1 ATR-multiple extensions of the move). Invalidation: close above $11.30 (EMA 21 and the Nov 9 high). (50% probability)
- Scenario 2: Bullish Oversold Relief Bounce — The RSI and MACD divergence plus easing CMF produce a mean-reversion bounce toward the EMA 21, then stall under resistance. Trigger: hold of $9.05 and a close above $10.65. Target: $11.25–$11.50 (EMA 21 and the Nov 9 high). Invalidation: close below $9.00. (30% probability)
- Scenario 3: Neutral Basing Range — Price chops between $9.00 and $10.80 as selling exhausts but buyers fail to take control. Trigger: low-volume consolidation with CMF near zero. Target: $9.30–$10.50. Invalidation: close outside $8.90–$11.00. (20% probability)
PRICE TARGETS
For the 20-day timeframe (to about Dec 5, 2026), the dominant trend (ADX 41, −DI 36) and the stacked bearish moving averages favor modest further downside. Oversold conditions and the divergence limit how far it likely goes, and a bounce is a meaningful risk. A 20-day horizon calls for a range width of about 8–12% (scaled to the 14–21 day band), but the stock's volatility (ATR $0.92, about 9.7% of price) justifies the upper end.
- Target Price: $8.85 (below the current $9.56)
- Expected Range: $7.90 to $10.95 (width $3.05, about 31.9% of price. This exceeds the standard 8–12% guide because the ATR is about 9.7% of price and 20 days of daily moves can easily exceed a 12% band. The range is deliberately widened for this stock's volatility.)
- Key Levels: Support at $9.05 (Nov 5 low), then $8.00. Resistance at $10.65 (near-term), then $11.26 (EMA 21).
OVERALL BIAS
OVERALL BIAS: BEARISH - Price is below every moving average, with ADX at 41 and −DI at 36 against +DI at 14. The failed rebound under the EMA 21 and the bearish flag continuation outweigh the mild MACD/RSI divergence and improving CMF, so the break of $9.05 is the more probable path.
This is educational analysis and not financial advice.